article thumbnail

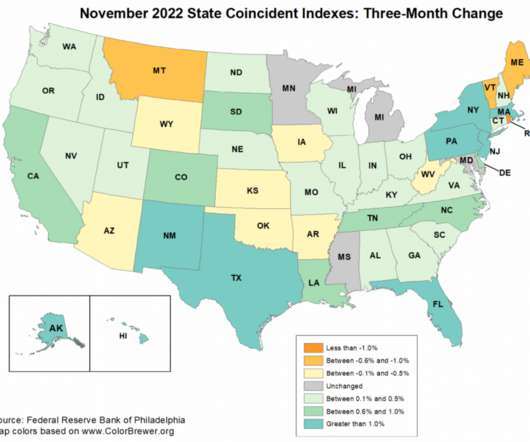
State Coincident Indicators: November 2022

The Big Picture

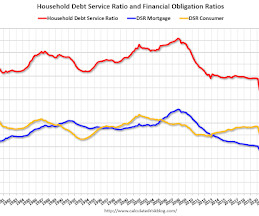
The Philly Fed map is based on Bureau of Labor Statistics (BLS) employment data for the states; the St Louis Fed builds on that, creating an ongoing chart that shows the relationship between the state data and recessions: Number of States with Negative Growth (State Coincident Indexes). UPDATE: Jan 4 2022 10:53am. By Kevin L.

Numbers 281
article thumbnail

I Ran The Numbers And They Work!

Random Roger's Retirement Planning

You can see that 60/40 equities/managed futures stayed close to 60/40 equities/bonds at a time when managed futures was doing poorly and then pulled ahead in recent years including going up 3.25% in 2022. The advantage that both managed futures portfolios had over traditional 60/40 is how well they did in 2022.

Numbers 77
Insiders

Sign Up for our Newsletter

This site is protected by reCAPTCHA and the Google Privacy Policy and Terms of Service apply.

article thumbnail

October Housing Starts: Near Record Number of Multi-Family Housing Units Under Construction

Calculated Risk

Today, in the CalculatedRisk Real Estate Newsletter: October Housing Starts: Near Record Number of Multi-Family Housing Units Under Construction Excerpt: The third graph shows the month-to-month comparison for total starts between 2022 (blue) and 2023 (red). in October compared to October 2022. Total starts were down 4.2%

Numbers 99
article thumbnail

September Housing Starts: Near Record Number of Multi-Family Housing Units Under Construction

Calculated Risk

Today, in the CalculatedRisk Real Estate Newsletter: September Housing Starts: Near Record Number of Multi-Family Housing Units Under Construction Excerpt: The third graph shows the month-to-month comparison for total starts between 2022 (blue) and 2023 (red). in September compared to September 2022. Total starts were down 7.2%

Numbers 102
article thumbnail

Real Estate Newsletter Articles this Week: Median House Prices Down 11.3% from Peak in June 2022; Record Number of Housing Units Under Construction

Calculated Risk

from Peak in June 2022 • December Housing Starts: Record Number of Housing Units Under Construction • 4th Look at Local Housing Markets in December California Home Sales down 44% YoY in December; Prices Down 2.8% At the Calculated Risk Real Estate Newsletter this week: • NAR: Existing-Home Sales Decreased to 4.02

Numbers 103
article thumbnail

The Latest In Financial #AdvisorTech (October 2022)

Nerd's Eye View

Welcome to the October 2022 issue of the Latest News in Financial #AdvisorTech – where we look at the big news, announcements, and underlying trends and developments that are emerging in the world of technology solutions for financial advisors!

article thumbnail

HVS: Q4 2022 Homeownership and Vacancy Rates

Calculated Risk

The Census Bureau released the Residential Vacancies and Homeownership report for Q4 2022. This survey might show the trend, but I wouldn't rely on the absolute numbers. National vacancy rates in the fourth quarter 2022 were 5.8 percent) and not statistically different from the rate in the third quarter 2022 (6.0

Numbers 128