This site uses cookies to improve your experience. To help us insure we adhere to various privacy regulations, please select your country/region of residence. If you do not select a country, we will assume you are from the United States. Select your Cookie Settings or view our Privacy Policy and Terms of Use.
Cookie Settings
Cookies and similar technologies are used on this website for proper function of the website, for tracking performance analytics and for marketing purposes. We and some of our third-party providers may use cookie data for various purposes. Please review the cookie settings below and choose your preference.
Used for the proper function of the website
Used for monitoring website traffic and interactions
Cookie Settings
Cookies and similar technologies are used on this website for proper function of the website, for tracking performance analytics and for marketing purposes. We and some of our third-party providers may use cookie data for various purposes. Please review the cookie settings below and choose your preference.
Strictly Necessary: Used for the proper function of the website
Performance/Analytics: Used for monitoring website traffic and interactions
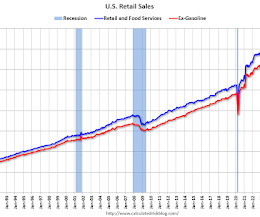
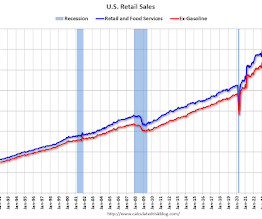
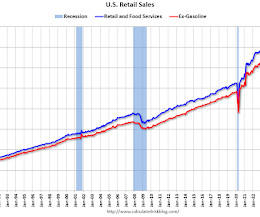
On a monthly basis, retail sales increased 0.2% from January to February (seasonally adjusted), and sales were up 3.1 retail and food services sales for February 2025, adjusted for seasonal variation and holiday and trading-day differences, but not for price changes, were $722.7 This graph shows retail sales since 1992.
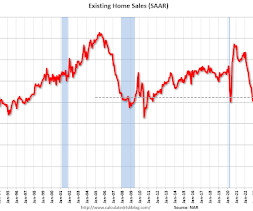
From the NAR: Existing-Home Sales Grew 3.4% in October; First Year-Over-Year Gain Since July 2021 Existing-home sales rose in October, according to the National Association of REALTORS®. Sales improved in all four major U.S. Year-over-year, sales elevated in three regions but were unchanged in the Northeast.
Today, in the Calculated Risk Real Estate Newsletter: New Home Sales Decrease Sharply to 610,000 Annual Rate in October Brief excerpt: Important: Sales in October were impacted by the hurricanes. Excluding the South, sales were up about 8% year-over-year. Sales in October 2024 were down 9.4% The south region was down 27.7%
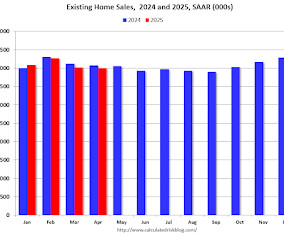
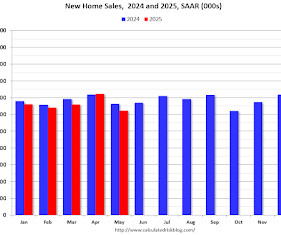
Today, in the Calculated Risk Real Estate Newsletter: New Home Sales Increase to 724,000 Annual Rate in March Brief excerpt: The Census Bureau reported New Home Sales in March were at a seasonally adjusted annual rate (SAAR) of 724 thousand. Sales in March 2025 were up 6.0% Sales in March 2025 were up 6.0%
Download a piece of our sales process to get a glimpse of what your practice could be. At Sound Income Group, we help advisors like you break through those barriers— without working more hours or chasing leads that go nowhere. The end zone is right there.
From the NAR: Existing-Home Sales Ascended 2.2% in December Existing-home sales climbed in December, according to the National Association of Realtors. Sales advanced in three major U.S. Year-over-year, sales accelerated in all four regions. On an annual basis, existing-home sales (4.06 Sales in December (4.24
From the NAR: Existing-Home Sales Receded 5.9% in March Existing-home sales descended in March, according to the National Association of REALTORS. Sales slid in all four major U.S. Year-over-year, sales dropped in the Midwest and South, increased in the West and were unchanged in the Northeast. Sales in March (4.02
From the NAR: Pending Home Sales Declined 6.3% in April Pending home sales decreased 6.3% The Pending Home Sales Index (PHSI)* a forward-looking indicator of home sales based on contract signings dove 6.3% Despite an increase in housing inventory, we are not seeing higher home sales. "At All four U.S.
Today, in the CalculatedRisk Real Estate Newsletter: NAR: Existing-Home Sales Decreased to 4.00 YoY Excerpt: Sales in April (4.00 below the April 2024 sales rate. This was the 3rd consecutive month with a year-over-year decline in sales. Sales decreased 2.0% Year-to-date, sales are down 2.4%
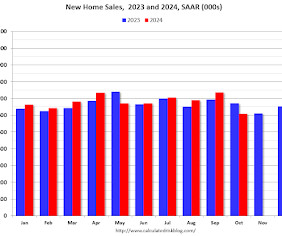
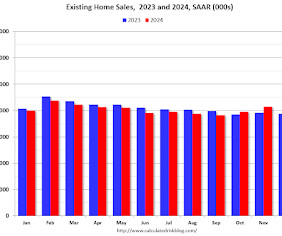
Today, in the CalculatedRisk Real Estate Newsletter: NAR: Existing-Home Sales Increased to 4.24 million SAAR in December Excerpt: Sales in December (4.24 above the December 2023 sales rate. Sales Year-over-Year and Not Seasonally Adjusted (NSA) The fourth graph shows existing home sales by month for 2023 and 2024.
From the NAR: Pending Home Sales Waned 4.6% in January Pending home sales pulled back 4.6% The Pending Home Sales Index (PHSI)* a forward-looking indicator of home sales based on contract signings fell 4.6% in January according to the National Association of REALTORS. regions, with the South seeing the greatest falloff.
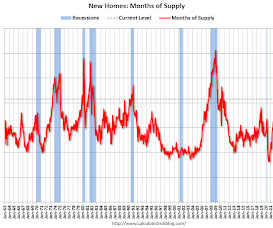
The Census Bureau reports New Home Sales in November were at a seasonally adjusted annual rate (SAAR) of 664 thousand. Sales of new single-family houses in November 2024 were at a seasonally adjusted annual rate of 664,000 , according to estimates released jointly today by the U.S. The dashed line is the current sales rate.
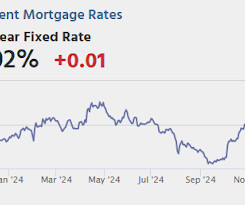
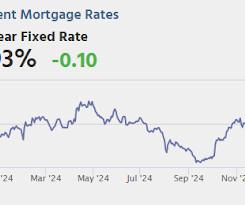
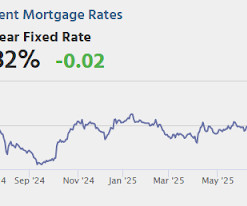
Friday: • At 8:30 AM ET, Retail sales for October will be released. increase in retail sales. Note: Mortgage rates are from MortgageNewsDaily.com and are for top tier scenarios. The consensus is for a 0.3% Also at 8:30 AM, The New York Fed Empire State manufacturing survey for November. The consensus is for a reading of 3.5,
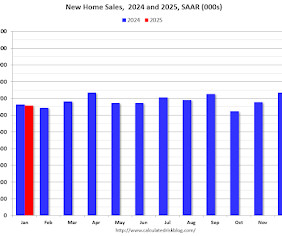
The Census Bureau reports New Home Sales in January were at a seasonally adjusted annual rate (SAAR) of 657 thousand. Sales of new single-family houses in January 2025 were at a seasonally adjusted annual rate of 657,000 , according to estimates released jointly today by the U.S. The dashed line is the current sales rate.
In this guest post, Taylor Schulte, founder of Define Financial, an independent RIA based in San Diego, CA, shares his approach to overcoming these challenges by selecting a client niche and implementing a 3-step sales process. This approach can lead to higher conversion rates while driving substantial revenue growth and profitability.
On a monthly basis, retail sales increased 0.1% from March to April (seasonally adjusted), and sales were up 5.2 retail and food services sales for April 2025, adjusted for seasonal variation and holiday and trading-day differences, but not for price changes, were $724.1 This graph shows retail sales since 1992.
Today, in the Calculated Risk Real Estate Newsletter: New Home Sales Decrease to 657,000 Annual Rate in January Brief excerpt: The Census Bureau reported New Home Sales in January were at a seasonally adjusted annual rate (SAAR) of 657 thousand. Sales in January 2025 were down 1.1% Sales in January 2025 were down 1.1%
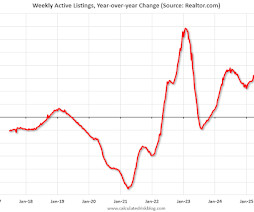
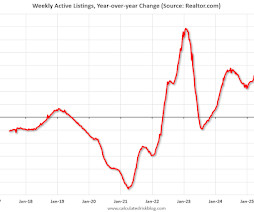
year-over-year The number of homes actively for sale remains on a strong upward trajectory, now 29.7% There were more than 1 million homes for sale last week, the highest inventory level since December 2019. Here is their weekly report: Weekly Housing Trends ViewData for Week Ending May 24, 2025 Active inventory climbed 29.7%
Today, in the Calculated Risk Real Estate Newsletter: New Home Sales Decrease to 623,000 Annual Rate in May Brief excerpt: The Census Bureau reported New Home Sales in May were at a seasonally adjusted annual rate (SAAR) of 623 thousand. The next graph shows new home sales for 2024 and 2025 by month (Seasonally Adjusted Annual Rate).
Today, in the Calculated Risk Real Estate Newsletter: California Home Sales Up 4.9% Elevated interest rates and economic uncertainty ease March home sales, C.A.R. reports Marchs sales pace fell 2.3 Elevated interest rates and economic uncertainty ease March home sales, C.A.R. reports Marchs sales pace fell 2.3
At 10:00 AM, New Home Sales for March from the Census Bureau. Note: Mortgage rates are from MortgageNewsDaily.com and are for top tier scenarios. Wednesday: At 7:00 AM ET, The Mortgage Bankers Association (MBA) will release the results for the mortgage purchase applications index.
This graph shows heavy truck sales since 1967 using data from the BEA. The dashed line is the April 2025 seasonally adjusted annual sales rate (SAAR) of 505 thousand. Heavy truck sales really collapsed during the great recession, falling to a low of 180 thousand SAAR in May 2009. Year-to-date (NSA) sales are down 4.6%.
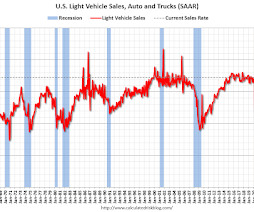
All day, Light vehicle sales for April. The consensus expectation is for light vehicle sales to be 16.8 The WardsAuto estimate is for sales of 17.4 The consensus is for a 0.3% increase in construction spending. million SAAR in April, down from 17.8 million in March (Seasonally Adjusted Annual Rate). million SAAR in April.
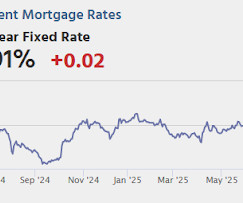
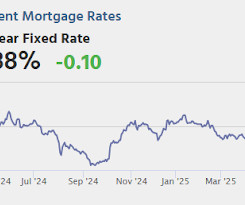
Tomorrow's Retail Sales data is capable of causing volatility in either direction, depending on the outcome. 30 year fixed 6.91% ] emphasis added Tuesday: • At 8:30 AM ET, Retail sales for May is scheduled to be released. 30 year fixed 6.91% ] emphasis added Tuesday: • At 8:30 AM ET, Retail sales for May is scheduled to be released.
On a monthly basis, retail sales decreased 0.9% from December to January (seasonally adjusted), and sales were up 4.2 retail and food services sales for January 2025, adjusted for seasonal variation and holiday and trading-day differences, but not for price changes, were $723.9 This graph shows retail sales since 1992.
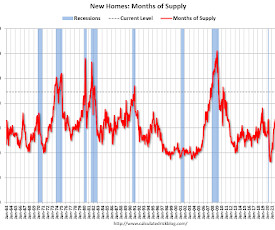
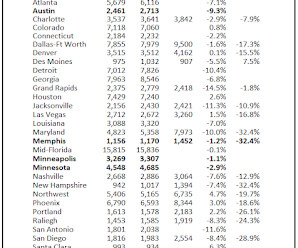
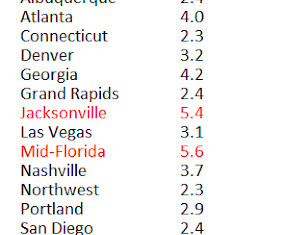
Today, in the Calculated Risk Real Estate Newsletter: 2nd Look at Local Housing Markets in October A brief excerpt: NOTE: The tables for active listings, new listings and closed sales all include a comparison to October 2019 for each local market (some 2019 data is not available). Here is a look at months-of-supply using NSA sales.
The Census Bureau reports New Home Sales in March were at a seasonally adjusted annual rate (SAAR) of 724 thousand. Sales of new single-family houses in March 2025 were at a seasonally-adjusted annual rate of 724,000 , according to estimates released jointly today by the U.S. The dashed line is the current sales rate.
This was originally a GSE only repeat sales, however there is also an expanded index. At 10:00 AM, New Home Sales for October from the Census Bureau. The National index was up 4.2% YoY in August and is expected to increase about the same in September. Also at 9:00 AM, FHFA House Price Index for September.
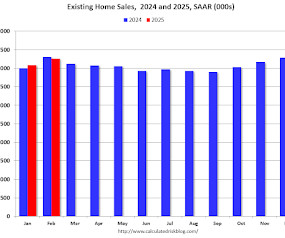
From the NAR: Existing-Home Sales Accelerated 4.2% in February Existing-home sales ascended in February, according to the National Association of REALTORS. For both monthly and year-over-year sales, two major U.S. Year-over-year, sales slid 1.2% (down from 4.31 Sales in February (4.26 million in February.
Today, in the CalculatedRisk Real Estate Newsletter: NAR: Existing-Home Sales Increased to 4.26 YoY Excerpt: Sales in February (4.26 below the February 2024 sales rate. This breaks the streak of fourth consecutive year-over-year increases in sales. Sales decreased 1.2% million SAAR in February; Down 1.2%
This graph shows heavy truck sales since 1967 using data from the BEA. The dashed line is the May 2025 seasonally adjusted annual sales rate (SAAR) of 446 thousand. Heavy truck sales really collapsed during the great recession, falling to a low of 180 thousand SAAR in May 2009. Year-to-date (NSA) sales are down 4.6%.
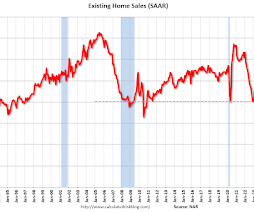
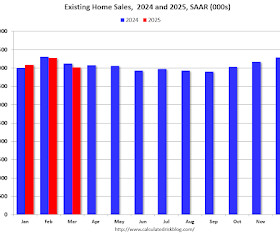
Today, in the CalculatedRisk Real Estate Newsletter: NAR: Existing-Home Sales Decreased to 4.02 YoY Excerpt: Sales in March (4.02 below the February 2024 sales rate. This was the 2nd consecutive month with a year-over-year decline, following four consecutive months with a year-over-year increases in sales.
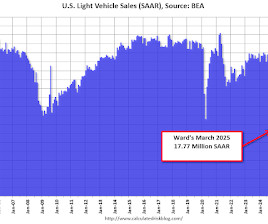
Wards Auto released their estimate of light vehicle sales for March: March U.S. Light-Vehicle Sales Surge in Preemptive Move to Potential Tariff-Based Price Increases (pay site). March sales were proof that U.S. This graph shows light vehicle sales since 2006 from the BEA (blue) and Wards' estimate for February (red).
NAR: Existing-Home Sales Increased to 3.96 million SAAR in October • Housing Starts Decreased to 1.311 million Annual Rate in October • Preliminary 2025 Housing Forecasts • California Home Sales Up 9.5% At the Calculated Risk Real Estate Newsletter this week: Click on graph for larger image. •
At 10:00 AM, New Home Sales for May from the Census Bureau. Note: Mortgage rates are from MortgageNewsDaily.com and are for top tier scenarios. Wednesday: • At 7:00 AM ET, The Mortgage Bankers Association (MBA) will release the results for the mortgage purchase applications index. •
Today, in the Calculated Risk Real Estate Newsletter: Final Look at Local Housing Markets in January and a Look Ahead to February Sales A brief excerpt: After the National Association of Realtors (NAR) releases the monthly existing home sales report , I pick up additional local market data that is reported after the NAR.
year-over-year The number of homes actively for sale remains on a strong upward trajectory, now 31.1% There were more than 1 million homes for sale last week, crossing this threshold for the first time since December 2019. higher than this time last year. This represents the 78th consecutive week of annual gains in inventory.
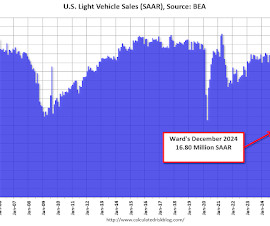
Light-Vehicle Sales Brighten Lackluster Year; Unusually High Drain on Inventory (pay content). But uncertainty over next year could be pulling sales into December, as some consumers could be expecting prices to rise depending on the extent of tariff increases or the possibility that EV credits will be eliminated. from a year ago.
From the NAR: Pending Home Sales Jumped 6.1% in March Pending home sales increased 6.1% The Pending Home Sales Index (PHSI)* a forward-looking indicator of home sales based on contract signings augmented 6.1% Year-over-year, pending transactions lessened by 0.6%. The Northeast PHSI dropped 0.5% from last month to 62.5,
On a monthly basis, retail sales increased 1.4% from February to March (seasonally adjusted), and sales were up 4.6 retail and food services sales for March 2025, adjusted for seasonal variation and holiday and trading-day differences, but not for price changes, were $734.9 This graph shows retail sales since 1992.
At 8:30 AM, Retail sales for March is scheduled to be released. increase in retail sales. Any number below 50 indicates that more builders view sales conditions as poor than good. Wednesday: At 7:00 AM ET, The Mortgage Bankers Association (MBA) will release the results for the mortgage purchase applications index.
Wards Auto released their estimate of light vehicle sales for December: U.S. Light-Vehicle Sales End 2024 With Long-Time High December, Q4 SAARs (pay site). This graph shows light vehicle sales since 2006 from the BEA (blue) and Wards' estimate for December (red). Sales in December (16.80 Click on graph for larger image.
From the NAR: Pending Home Sales Advanced 7.4% in September ending home sales rose in September, according to the National Association of REALTORS®. Year-over-year, the Northeast and West registered increases while sales remained steady in the Midwest and South. in September, the highest level since March (78.3).
From the NAR: Existing-Home Sales Edged Lower by 0.5% in April Existing-home sales slowed in April, according to the National Association of REALTORS. Sales dipped in the Northeast and West, grew in the Midwest and were unchanged in the South. Year-over-year, sales declined in three regions and remained steady in the Northeast.
We organize all of the trending information in your field so you don't have to. Join 36,000+ users and stay up to date on the latest articles your peers are reading.
You know about us, now we want to get to know you!
Let's personalize your content
Let's get even more personalized
We recognize your account from another site in our network, please click 'Send Email' below to continue with verifying your account and setting a password.


Let's personalize your content