This site uses cookies to improve your experience. To help us insure we adhere to various privacy regulations, please select your country/region of residence. If you do not select a country, we will assume you are from the United States. Select your Cookie Settings or view our Privacy Policy and Terms of Use.
Cookie Settings
Cookies and similar technologies are used on this website for proper function of the website, for tracking performance analytics and for marketing purposes. We and some of our third-party providers may use cookie data for various purposes. Please review the cookie settings below and choose your preference.
Used for the proper function of the website
Used for monitoring website traffic and interactions
Cookie Settings
Cookies and similar technologies are used on this website for proper function of the website, for tracking performance analytics and for marketing purposes. We and some of our third-party providers may use cookie data for various purposes. Please review the cookie settings below and choose your preference.
Strictly Necessary: Used for the proper function of the website
Performance/Analytics: Used for monitoring website traffic and interactions
The first graph shows the unemployment rate by four levels of education (all groups are 25 years and older) through June 2025. Note: This is an update to a post from several years ago. Unfortunately, this data only goes back to 1992 and includes only three recessions (the stock / tech bust in 2001, and the housing bust/financial crisis, and the 2020 pandemic).
At the Calculated Risk Real Estate Newsletter this week: Click on graph for larger image. • FHFA’s National Mortgage Database: Outstanding Mortgage Rates, LTV and Credit Scores • Freddie Mac House Price Index Declined in May; Up 2.2% Year-over-year • Fannie and Freddie: Single Family Serious Delinquency Rates Decreased in May • Asking Rents Mostly Unchanged Year-over-year This is usually published 4 to 6 times a week and provides more in-depth analysis of the housing market.
This will be a very light week for economic data. -- Monday, July 7th -- No major economic releases scheduled. -- Tuesday, July 8th -- 6:00 AM ET: NFIB Small Business Optimism Index for June. -- Wednesday, July 9th -- 7:00 AM ET: The Mortgage Bankers Association (MBA) will release the results for the mortgage purchase applications index. 2:00 PM: FOMC Minutes , Meeting of June 17-18 -- Thursday, July 10th -- 8:30 AM: The initial weekly unemployment claims report will be released.
Note: Mortgage rates are from MortgageNewsDaily.com and are for top tier scenarios. There will be additional trade related distortions in Q2 boosting GDP. From Goldman: Following this morning’s data, we have lowered our Q2 GDP tracking estimate by 0.6pp to +3.0% (quarter-over-quarter annualized). Our Q2 domestic final sales estimate stands at +0.7%.
From the BLS: Employment Situation Total nonfarm payroll employment increased by 147,000 in June, and the unemployment rate changed little at 4.1 percent , the U.S. Bureau of Labor Statistics reported today. Job gains occurred in state government and health care. Federal government continued to lose jobs. The change in total nonfarm payroll employment for April was revised up by 11,000, from +147,000 to +158,000, and the change for May was revised up by 5,000, from +139,000 to +144,000.
The headline jobs number in the June employment report was above expectations and April and May payrolls were revised up by 16,000 combined. The participation rate decreased, the employment population ratio was unchanged, and the unemployment rate was decreased to 4.1%. NOTE: State and local government education hiring was reported at 63.5 thousand in June (seasonally adjusted).
The Census Bureau and the Bureau of Economic Analysis reported : The U.S. Census Bureau and the U.S. Bureau of Economic Analysis announced today that the goods and services deficit was $71.5 billion in May , up $11.3 billion from $60.3 billion in April, revised. May exports were $279.0 billion, $11.6 billion less than April exports. May imports were $350.5 billion, $0.3 billion less than April imports. emphasis added Click on graph for larger image.
Note: Mortgage rates are from MortgageNewsDaily.com and are for top tier scenarios. Thursday: • At 8:30 AM ET, Employment Report for June. The consensus is for 129,000 jobs added, and for the unemployment rate to be unchanged at 4.2%. • Also at 8:30 AM, The initial weekly unemployment claims report will be released. The consensus is for initial claims to increase to 239 thousand from 236 thousand last week. • Also at 8:30 AM, Trade Balance report for May from the Census Bureau.
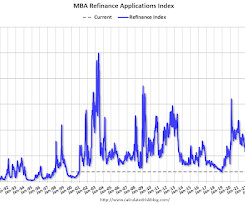
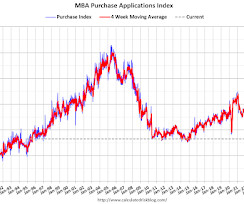
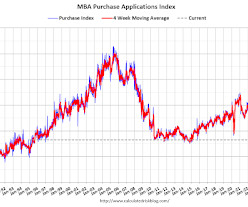
From the MBA: Mortgage Applications Increase in Latest MBA Weekly Survey Mortgage applications increased 2.7 percent from one week earlier, according to data from the Mortgage Bankers Association’s (MBA) Weekly Mortgage Applications Survey for the week ending June 27, 2025. Last week’s results included an adjustment for the Juneteenth holiday. The Market Composite Index, a measure of mortgage loan application volume, increased 2.7 percent on a seasonally adjusted basis from one week earlier.
On Thursday at 8:30 AM ET, the BLS will release the employment report for June. The consensus is for 129,000 jobs added, and for the unemployment rate to be unchanged at 4.2%. There were 139,000 jobs added in May, and the unemployment rate was at 4.2%. From Goldman Sachs: We do not place much weight on the ADP miss because of ADP’s limited correlation with BLS private payrolls over the last few years.
Note: Mortgage rates are from MortgageNewsDaily.com and are for top tier scenarios. Wednesday: • At 7:00 AM ET, The Mortgage Bankers Association (MBA) will release the results for the mortgage purchase applications index. • At 8:15 AM, The ADP Employment Report for June. This report is for private payrolls only (no government). The consensus is for 110,000 payroll jobs added in June, up from 37,000 in May.
Today, in the Calculated Risk Real Estate Newsletter: Fannie and Freddie: Single Family Serious Delinquency Rates Decreased in May Excerpt: Freddie Mac reported that the Single-Family serious delinquency rate in May was 0.55%, down from 0.57% April. Freddie's rate is up year-over-year from 0.49% in May 2024, however, this is below the pre-pandemic level of 0.60%.
From Cotality (formerly CoreLogic): US home price insights — July 2025 Spring homebuying season continues to be defined by slower price growth and tepid home buying activity. • Year-over-year price growth dipped to 1.8% in May 2025 , down from 5% price growth last May and slowest since the winter of 2012. • Seasonal increase in home prices continues to be weak, up 0.3% compared to the month before, and less than half of 0.8% increase typically seen between April and May • In more affordable Midw
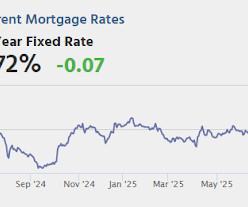
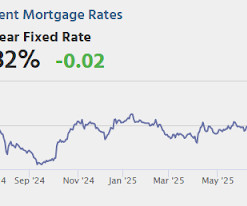
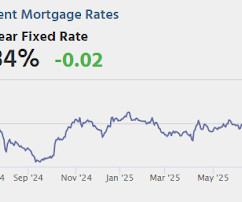
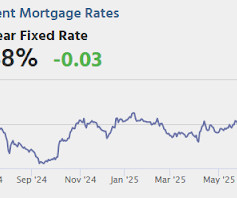
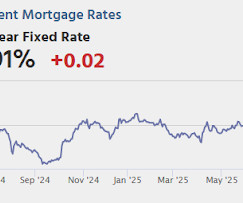
From Matthew Graham at Mortgage News Daily: Mortgage Rates Take Another Step Toward April Lows April 3rd and 4th saw the average top tier 30yr fixed mortgage rates well into the "mid 6's." Many lenders were able to quote 6.5% at the time. Just a few days ago, we noted there was still a ways to go before breaking below those early April levels, but the past few days have taken us within striking distance. [ 30 year fixed 6.67% ] emphasis added Tuesday: • At 9:30 AM ET, Discussion, Fed Chair Jerom
Today, in the Calculated Risk Real Estate Newsletter: Freddie Mac House Price Index Declined in May; Up 2.2% Year-over-year A brief excerpt: Freddie Mac reported that its “National” Home Price Index (FMHPI) decreased -0.23% month-over-month (MoM) on a seasonally adjusted (SA) basis in May. On a year-over-year (YoY) basis, the National FMHPI was up 2.2% in May, down from up 2.6% YoY in April.
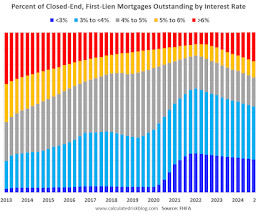
Today, in the Calculated Risk Real Estate Newsletter: FHFA’s National Mortgage Database: Outstanding Mortgage Rates, LTV and Credit Scores A brief excerpt: Here are some graphs on outstanding mortgages by interest rate, the average mortgage interest rate, borrowers’ credit scores and current loan-to-value (LTV) from the FHFA’s National Mortgage Database through Q1 2025 (released last Friday).
Weekend: • Schedule for Week of June 29, 2025 Monday: • At 9:45 AM ET, Chicago Purchasing Managers Index for June. • At 10:30 AM, Dallas Fed Survey of Manufacturing Activity for June. From CNBC: Pre-Market Data and Bloomberg futures S&P 500 are up 17 and DOW futures are up 212 (fair value). Oil prices were down over the last week with WTI futures at $65.52 per barrel and Brent at $67.77 per barrel.
The key report scheduled for this week is the June employment report to be released on Thursday. Other key reports include the June ISM Manufacturing survey, June Vehicle Sales and the Trade Deficit for May. -- Monday, June 30th -- 9:45 AM: Chicago Purchasing Managers Index for June. 10:30 AM: Dallas Fed Survey of Manufacturing Activity for June. -- Tuesday, July 1st -- 9:30 AM: Discussion, Fed Chair Jerome Powell , Policy Panel Discussion , At the European Central Bank Forum on Central Banking
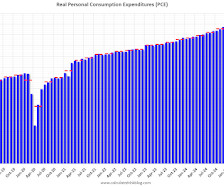
From the BEA: Personal Income and Outlays, May 2025 Personal income decreased $109.6 billion (0.4 percent at a monthly rate) in May , according to estimates released today by the U.S. Bureau of Economic Analysis. Disposable personal income (DPI)—personal income less personal current taxes—decreased $125.0 billion (0.6 percent) and personal consumption expenditures (PCE) decreased $29.3 billion (0.1 percent).
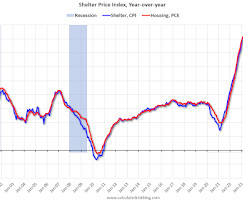
Here is a graph of the year-over-year change in shelter from the CPI report and housing from the PCE report this morning, both through May 2025. CPI Shelter was up 3.9% year-over-year in May , down from 4.0% in April, and down from the cycle peak of 8.2% in March 2023. Housing (PCE) was up 4.1% YoY in May , down from 4.2% in April and down from the cycle peak of 8.3% in April 2023.
Note: Mortgage rates are from MortgageNewsDaily.com and are for top tier scenarios. Friday: • At 8:30 AM ET: Personal Income and Outlays, May 2024. The consensus is for a 0.4% increase in personal income, and for a 0.3% increase in personal spending. And for the Core PCE price index to increase 0.1%. PCE prices are expected to be up 2.2% YoY, and core PCE prices up 2.5% YoY. • At 10:00 AM: University of Michigan's Consumer sentiment index (Final for June).
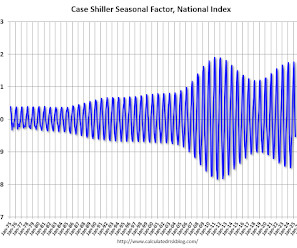
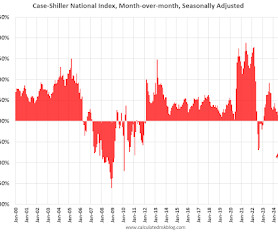
Another update. a few key points: 1) There is a clear seasonal pattern for house prices. 2) The surge in distressed sales during the housing bust distorted the seasonal pattern. This was because distressed sales (at lower price points) happened at a steady rate all year, while regular sales followed the normal seasonal pattern. This made for larger swings in the seasonal factor during the housing bust. 3) The seasonal swings have increased recently without a surge in distressed sales.
Note: Mortgage rates are from MortgageNewsDaily.com and are for top tier scenarios. Thursday: • At 8:30 AM: The initial weekly unemployment claims report will be released. The consensus is for initial claims to increase to 247 thousand from 245 thousand last week. • At 8:30 AM: Gross Domestic Product, 1st quarter 2024 (Third estimate). The consensus is that real GDP decreased 0.2% annualized in Q1, unchanged from the second estimate of a 0.2% decrease. • At 8:30 AM: Durable Goods Orders for May
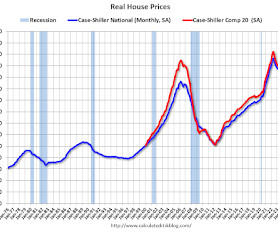
Today, in the Calculated Risk Real Estate Newsletter: Inflation Adjusted House Prices 1.7% Below 2022 Peak Excerpt: It has been 19 years since the housing bubble peak, ancient history for many readers! In the April Case-Shiller house price index released Tuesday, the seasonally adjusted National Index (SA), was reported as being 78% above the bubble peak in 2006.
From the MBA: Mortgage Applications Increase in Latest MBA Weekly Survey Mortgage applications increased 1.1 percent from one week earlier, according to data from the Mortgage Bankers Association’s (MBA) Weekly Mortgage Applications Survey for the week ending June 20, 2025. This week’s results include an adjustment for the Juneteenth holiday. The Market Composite Index, a measure of mortgage loan application volume, increased 1.1 percent on a seasonally adjusted basis from one week earlier.
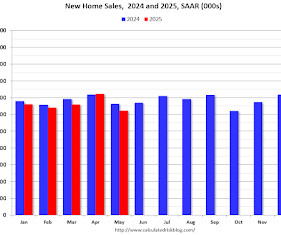
Today, in the Calculated Risk Real Estate Newsletter: New Home Sales Decrease to 623,000 Annual Rate in May Brief excerpt: The Census Bureau reported New Home Sales in May were at a seasonally adjusted annual rate (SAAR) of 623 thousand. The previous three months were revised down. The next graph shows new home sales for 2024 and 2025 by month (Seasonally Adjusted Annual Rate).
Note: Mortgage rates are from MortgageNewsDaily.com and are for top tier scenarios. Wednesday: • At 7:00 AM ET, The Mortgage Bankers Association (MBA) will release the results for the mortgage purchase applications index. • At 10:00 AM, New Home Sales for May from the Census Bureau. The consensus is for 710 thousand SAAR, down from 743 thousand in April. • Also at 10:00 AM, Testimony, Fed Chair Jerome Powell, Semiannual Monetary Policy Report to Congress , Before the U.S.
S&P/Case-Shiller released the monthly Home Price Indices for April ("April" is a 3-month average of February, March and April closing prices). This release includes prices for 20 individual cities, two composite indices (for 10 cities and 20 cities) and the monthly National index. From S&P S&P CoreLogic Case-Shiller Index Records 2.7% Annual Gain in April 2025 The S&P CoreLogic Case-Shiller U.S.
Today, in the Calculated Risk Real Estate Newsletter: Case-Shiller: National House Price Index Up 2.7% year-over-year in April Excerpt: S&P/Case-Shiller released the monthly Home Price Indices for April ("April" is a 3-month average of February, March and April closing prices). February closing prices include some contracts signed in December, so there is a significant lag to this data.
From Intercontinental Exchange: ICE First Look at Mortgage Performance: Delinquencies Hold Steady and Foreclosure Sales Rise to Highest Level Since Early 2023 Intercontinental Exchange, Inc. (NYSE:ICE). today released its May 2025 ICE First Look, which shows that delinquencies and foreclosure activity continues to trend slightly higher on an annual basis despite some seasonal and disaster recovery related improvement.
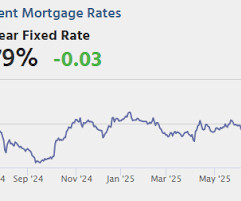
From Matthew Graham at Mortgage News Daily: Mortgage Rates Lowest Since May 1st Mortgage rates ended the previous week roughly in line with the best levels since May 1st. Today's modest improvement made it official. Mortgage rates are primarily a function of trading levels in the bond market and bonds have had a few reasons to move at the start of the new week.
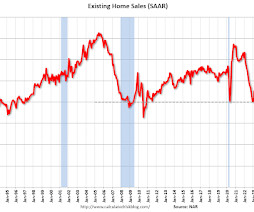
The key reports this week are May New and Existing Home sales, the third estimate of Q1 GDP, Personal Income and Outlays for May and the April Case-Shiller house price index. For manufacturing, the June Richmond and Kansas City Fed manufacturing surveys will be released. Fed Chair Powell testifies on the Semiannual Monetary Policy Report to Congress. -- Monday, June 23rd -- 10:00 AM: Existing Home Sales for May from the National Association of Realtors (NAR).
A year ago I wrote: The Art of the Soft Landing A few excerpts and an updated graph. The "Art of the Soft Landing" requires that the Fed reduce rates quick enough to keep economic growth positive, and slow enough not to reignite inflation. My view is a soft landing is achieved if growth stays positive, inflation returns to target, and the yield curve flattens or reverts to normal (long yields higher than short yields).
Fed Chair Powell press conference video here or on YouTube here , starting at 2:30 PM ET. FOMC Statement: Although swings in net exports have affected the data, recent indicators suggest that economic activity has continued to expand at a solid pace. The unemployment rate remains low, and labor market conditions remain solid. Inflation remains somewhat elevated.
Statement here. Fed Chair Powell press conference video here or on YouTube here , starting at 2:30 PM ET. Here are the projections. The projections are pretty bearish. The BEA's advance estimate for Q1 GDP showed real growth at -0.2% annualized. There is a wide range of estimates for Q2 GDP, but it is forecast to be over 3.0% (as Q1 distortions reverse).
From the MBA: Mortgage Applications Decrease in Latest MBA Weekly Survey Mortgage applications decreased 2.6 percent from one week earlier, according to data from the Mortgage Bankers Association’s (MBA) Weekly Mortgage Applications Survey for the week ending June 13, 2025. The Market Composite Index, a measure of mortgage loan application volume, decreased 2.6 percent on a seasonally adjusted basis from one week earlier.
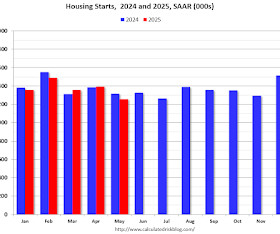
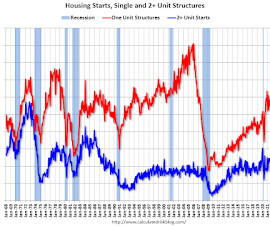
Today, in the Calculated Risk Real Estate Newsletter: Housing Starts Decreased to 1.256 million Annual Rate in May A brief excerpt: Total housing starts in May were below expectations; however, starts in March and April were revised up, combined. The third graph shows the month-to-month comparison for total starts between 2024 (blue) and 2025 (red).
Note: Mortgage rates are from MortgageNewsDaily.com and are for top tier scenarios. Wednesday: • At 7:00 AM ET, The Mortgage Bankers Association (MBA) will release the results for the mortgage purchase applications index. • At 8:30 AM, The initial weekly unemployment claims report will be released. The consensus is for initial claims of 250 thousand, up from 248 thousand last week. • Also at 8:30 AM ET, Housing Starts for May.
From Matthew Graham at Mortgage News Daily: Mortgage Rates Drift Slightly Higher to Start The Week While there's been no shortage of political and geopolitical headlines over the past 2 business days, there hasn't been much by way of inspiration for the bond market. Bonds (and, thus, rates) have moved nonetheless. Tomorrow's Retail Sales data is capable of causing volatility in either direction, depending on the outcome.
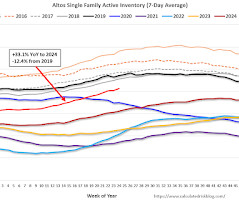
Altos reports that active single-family inventory was up 2.1% week-over-week. Inventory is now up 32.2% from the seasonal bottom in January and is increasing. Usually, inventory is up about 18% from the seasonal low by this week in the year. So, 2025 is seeing a larger than normal pickup in inventory. The first graph shows the seasonal pattern for active single-family inventory since 2015.
Weekend: • Schedule for Week of June 15, 2025 Monday: • At 8:30 AM ET, The New York Fed Empire State manufacturing survey for June. The consensus is for a reading of -6.0, up from -9.2. From CNBC: Pre-Market Data and Bloomberg futures S&P 500 are down 17 and DOW futures are down 134 (fair value). Oil prices were up over the last week with WTI futures at $75.49 per barrel and Brent at $76.72 per barrel.
Most analysts expect no change to FOMC policy at the meeting this week, keeping the target range at 4 1/4 to 4 1/2 percent. Market participants currently expect the FOMC to also be on hold at the July meeting, with the next rate cut in September, and a second rate cut in December. From BofA: The Fed has made it clear that the policy rate will remain unchanged at its June meeting.
The key reports this week are May Retail Sales and Housing Starts. For manufacturing, Industrial Production, and the NY and Philly Fed manufacturing surveys, will be released this week. The FOMC meets on Tuesday and Wednesday, and rates are expected to be unchanged. -- Monday, June 16th -- 8:30 AM: The New York Fed Empire State manufacturing survey for June.
What this means: On a weekly basis, Realtor.com reports the year-over-year change in active inventory and new listings. On a monthly basis, they report total inventory. For May, Realtor.com reported inventory was up 31.5% YoY, but still down 14.4% compared to the 2017 to 2019 same month levels. Realtor.com has monthly and weekly data on the existing home market.
We organize all of the trending information in your field so you don't have to. Join 36,000+ users and stay up to date on the latest articles your peers are reading.
You know about us, now we want to get to know you!
Let's personalize your content
Let's get even more personalized
We recognize your account from another site in our network, please click 'Send Email' below to continue with verifying your account and setting a password.


Let's personalize your content