article thumbnail

Four High Frequency Indicators for the Economy

Calculated Risk

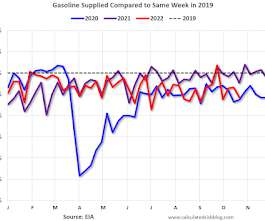
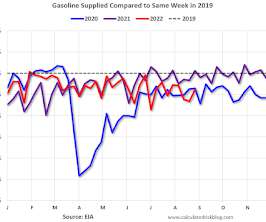
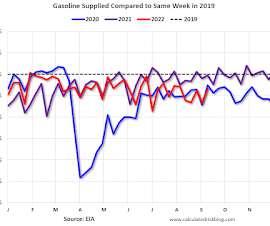
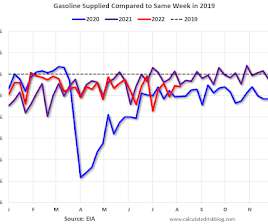
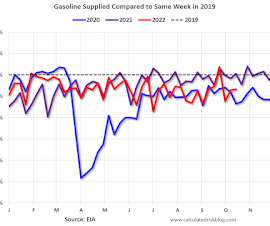
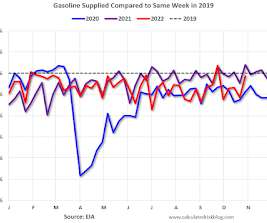
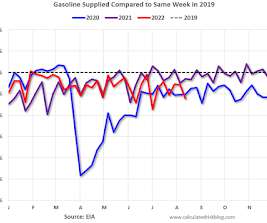
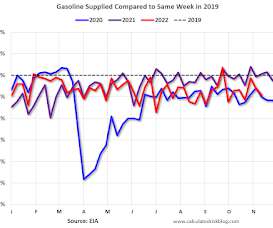
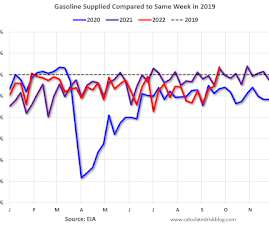
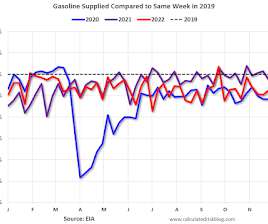
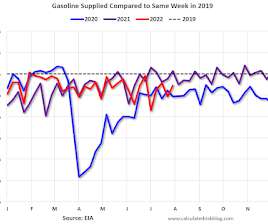
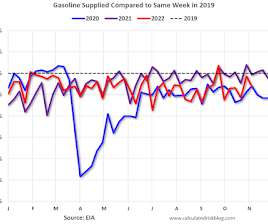
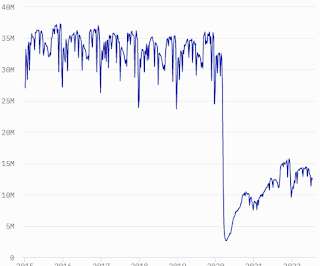
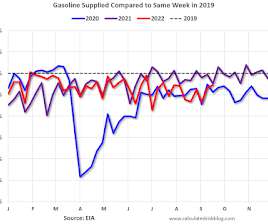
It was interesting to watch these sectors recover as the pandemic impact subsided. -- Airlines: Transportation Security Administration -- The TSA is providing daily travel numbers. This data is as of November 6th. Click on graph for larger image. Black is 2020, Blue is 2021 and Red is 2022. The data is from BoxOfficeMojo through November 3rd.

Economy 136
article thumbnail

Four High Frequency Indicators for the Economy

Calculated Risk

Notes: I've added back gasoline supplied to see if there is an impact from higher gasoline prices. -- Airlines: Transportation Security Administration -- The TSA is providing daily travel numbers. This data is as of September 11th. Click on graph for larger image. Black is 2020, Blue is 2021 and Red is 2022.

Economy 145
Insiders

Sign Up for our Newsletter

This site is protected by reCAPTCHA and the Google Privacy Policy and Terms of Service apply.

article thumbnail

Four High Frequency Indicators for the Economy

Calculated Risk

Notes: I've added back gasoline supplied to see if there is an impact from higher gasoline prices. -- Airlines: Transportation Security Administration -- The TSA is providing daily travel numbers. This data is as of September 25th. Click on graph for larger image. Black is 2020, Blue is 2021 and Red is 2022.

Economy 137
article thumbnail

Four High Frequency Indicators for the Economy

Calculated Risk

Notes: I've added back gasoline supplied to see if there is an impact from higher gasoline prices. -- Airlines: Transportation Security Administration -- The TSA is providing daily travel numbers. This data is as of August 7th. Click on graph for larger image. Black is 2020, Blue is 2021 and Red is 2022.

Economy 140
article thumbnail

Four High Frequency Indicators for the Economy

Calculated Risk

Notes: I've added back gasoline supplied to see if there is an impact from higher gasoline prices. -- Airlines: Transportation Security Administration -- The TSA is providing daily travel numbers. This data is as of September 4th. Click on graph for larger image. Black is 2020, Blue is 2021 and Red is 2022.

Economy 140
article thumbnail

Five High Frequency Indicators for the Economy

Calculated Risk

Apple has discontinued "Apple mobility", and restaurant traffic is mostly back to normal. -- Airlines: Transportation Security Administration -- The TSA is providing daily travel numbers. This data is as of July 31st. Click on graph for larger image. Black is 2020, Blue is 2021 and Red is 2022.

Economy 144
article thumbnail

Sunday links: disregarding the facts

Abnormal Returns

nytimes.com) Regional banks are a linchpin for the economy. grist.org) Anti-Asian hate crimes have been rising since 2016. bloomberg.com) Economy Why we should be celebrating the current employment situation. tker.co) You can expect the Case-Shiller housing numbers to turn negative year-over-year in the next few months.