article thumbnail

Wealth Inequality Starts at the Top

The Big Picture

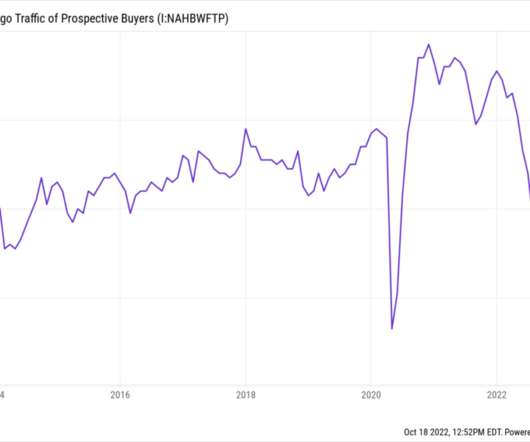
Source: FRED Wealth disparities get ever more lopsided the higher up the economic strata you climb; there is more disparity with the top 1% than the top 10%, but the biggest spreads are at the top 0.1% (and above). Consider the chart at top, created by Invictus via FRED. And, it has accelerated over the past few decades.

article thumbnail

Collapse in Prospective Home Buyer Traffic

The Big Picture

This brings us to the chart: The one above shows the traffic of prospective buyers looking at a new home (2014- 2022); the one below goes back to the 1980s. The four largest drops occurred during distinct periods of economic distress: 1990 (recession), 2006-09 (GFC), 2020 (pandemic/recession), and today (FOMC 300 bp rate hike).

Budgeting 363
Insiders

Sign Up for our Newsletter

This site is protected by reCAPTCHA and the Google Privacy Policy and Terms of Service apply.

article thumbnail

Another Strong Jobs Report? Phooey, and I Can Prove It

Mish Talk

The number of working-age persons people not in the labor force rose by 359,000 in November and is back over 100 million. Birth Death Model Starting January 2014, I dropped the Birth/Death Model charts from this report. The model is wrong at economic turning points and is also heavily revised and thus essentially useless.

article thumbnail

Nifty 50 hits 20,000! Here are Shocking Nifty 50 Moments – From Terror Attacks to Demonetization!

Trade Brains

Nifty 50 first hit 10,000 on July 26, 2017, and it took more than 21 years to double that number. For many people, 20,000 is not just a number; but happiness for many. The Ripple effect saw the market fall a number of times in 2008. On September 1, 2014, the Nifty touched 8,000. Now, Nifty is on its way to 21,000 points.

Numbers 59
article thumbnail

How Did Covid Impact the Minimum Wage Someone Would Accept for a Job?

Mish Talk

Reservation Wage Between March 2014 and March 2020 Working: +19.3 With demand for jobs in some sectors still high, and increasing number of boomers retiring, we have intense wage pressures. Regarding expectations, the average expected wage offer (conditional on receiving one) also increased and reached a new high.

Food 130
article thumbnail

India’s IPO Revolution: Bullish Boom or Bearish Backlash?

Trade Brains

India’s IPO market has made a strong comeback this year, making it the global leader in the number of IPOs so far in 2023 and attracting investors to take advantage of the renewed interest in public offerings on Dalal Street. What do the numbers tell about IPOs? 2014 5 0.14 2015 21 1.63 2016 26 3.18 2017 36 8.06

Numbers 64
article thumbnail

These Are the Goods

The Irrelevant Investor

Articles In hindsight, we can see that the value in 2014 $AAPL was real while the value in 2014 $IBM was fake. By Barry Ritholtz People’s actions don’t always live up to rational economic theories because of unintended consequences By Ben Carlson Every past decline looks like an opportunity, every future decline looks like a risk.

Math 52