
TSA: Airline Travel about 5% Above 2019 Levels
Calculated Risk
APRIL 22, 2024
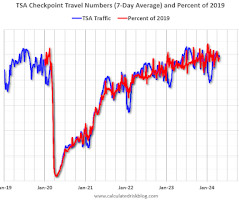
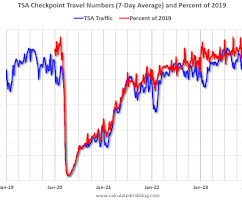
The TSA is providing daily travel numbers. The red line is the percent of 2019 for the seven-day average. Air travel - as a percent of 2019 - is tracking at about 105% of pre-pandemic levels. This data is as of April 21st. Click on graph for larger image.


Let's personalize your content