article thumbnail

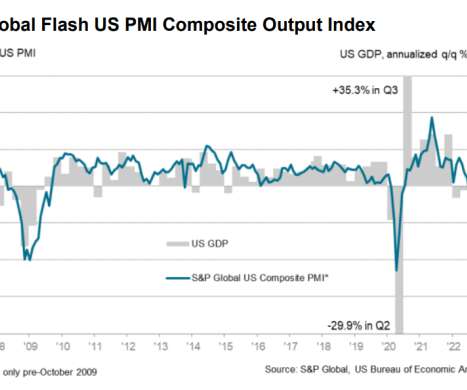
US Composite PMI Suggests the Economy is On the Verge of Recession

Mish Talk

The PMI numbers are diffusion indexes. With the exception of the early stages of the pandemic, the decrease in total new sales was the sharpest since 2009. November even saw increasing numbers of suppliers, factories and service providers offering discounts to help boost flagging sales. October: 47.8). 3-month low.

Economy 290
article thumbnail

5 Unusual Economic Indicators That Can Tell You About the Economy

Trade Brains

However, there are many other lesser-known indicators that can actually provide valuable insights and are helpful for the economy. Back in the autumn of 2001, he noticed that when the US economy was struggling due to the recession, lipstick sales were actually going up instead of down. Keep reading to find out what they are!

Economy 64
Insiders

Sign Up for our Newsletter

This site is protected by reCAPTCHA and the Google Privacy Policy and Terms of Service apply.

article thumbnail

U.S. stocks open lower on strong retail sales

MarketWatch

stock indexes opened lower on Wednesday after January retail sales number came in higher than expected, a sign that the U.S. Sales at U.S. Sales at U.S. Retail sales are a big part of consumer spending and could offer clues about the strength of the economy. The S&P 500 was off 0.6%

Retail 98
article thumbnail

Wednesday links: nothing to do with money

Abnormal Returns

(theverge.com) Ozempic accounted for 41% of Novo Nordisk’s ($NVO) total sales in 2023. wapo.st) Why is Apple ($AAPL) publicly touting its Apple Card spending numbers? blog.johnwallstreet.com) Economy The labor market continues to soften. spyglass.org) Sports The PGA Tour just scored a big, non-Saudi, investment.

article thumbnail

Four High Frequency Indicators for the Economy

Calculated Risk

It was interesting to watch these sectors recover as the pandemic impact subsided. -- Airlines: Transportation Security Administration -- The TSA is providing daily travel numbers. This data is as of November 6th. Click on graph for larger image. Black is 2020, Blue is 2021 and Red is 2022. The data is from BoxOfficeMojo through November 3rd.

Economy 135
article thumbnail

Four High Frequency Indicators for the Economy

Calculated Risk

Notes: I've added back gasoline supplied to see if there is an impact from higher gasoline prices. -- Airlines: Transportation Security Administration -- The TSA is providing daily travel numbers. This data is as of September 11th. Click on graph for larger image. Black is 2020, Blue is 2021 and Red is 2022.

Economy 145
article thumbnail

Four High Frequency Indicators for the Economy

Calculated Risk

Notes: I've added back gasoline supplied to see if there is an impact from higher gasoline prices. -- Airlines: Transportation Security Administration -- The TSA is providing daily travel numbers. This data is as of September 25th. Click on graph for larger image. Black is 2020, Blue is 2021 and Red is 2022.

Economy 137