
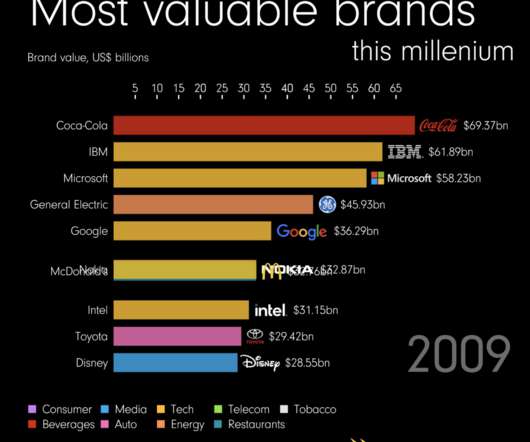
Most Valuable Brands, 2000–2022
The Big Picture
JANUARY 16, 2023
The post Most Valuable Brands, 2000–2022 appeared first on The Big Picture. For some companies, a brand is something that helps slightly boost customer engagement and sales. But for others, including some of the largest companies in the world, a strong brand is one of their most valuable assets.


Let's personalize your content