
Four High Frequency Indicators for the Economy
Calculated Risk
SEPTEMBER 12, 2022
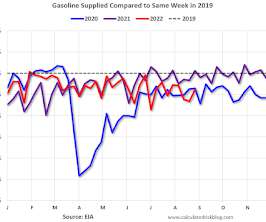
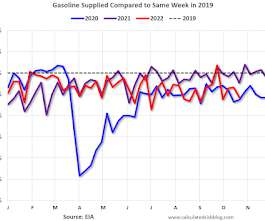
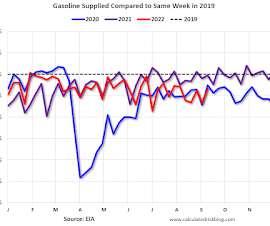
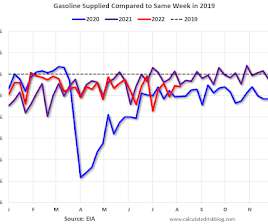
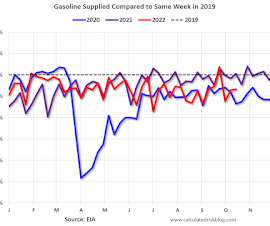
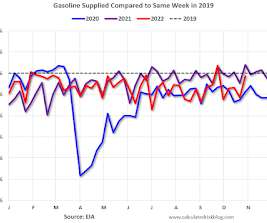
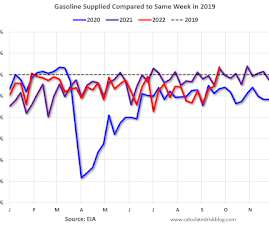
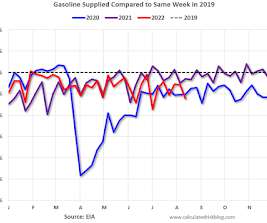
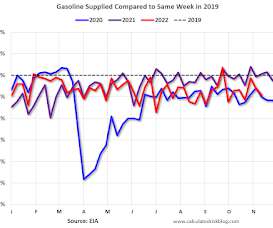
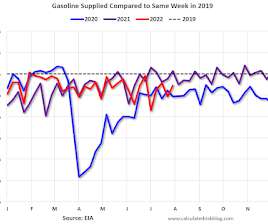
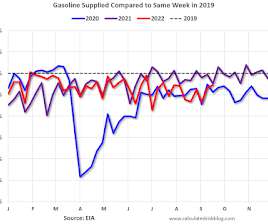
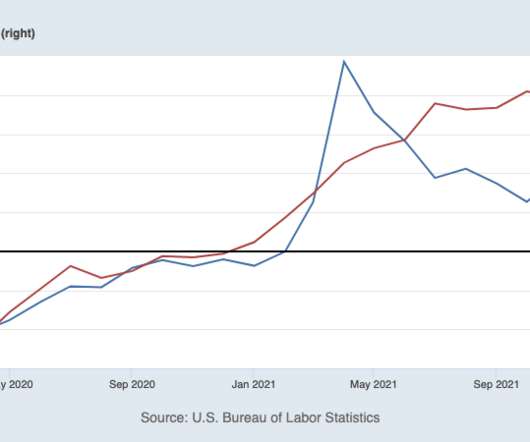
This data shows the 7-day average of daily total traveler throughput from the TSA for 2019 (Light Blue), 2020 (Black), 2021 (Blue) and 2022 (Red). The dashed line is the percent of 2019 for the seven-day average. from the same day in 2019 (90.9% Dashed purple is 2019 (STR is comparing to a strong year for hotels).


Let's personalize your content