This site uses cookies to improve your experience. To help us insure we adhere to various privacy regulations, please select your country/region of residence. If you do not select a country, we will assume you are from the United States. Select your Cookie Settings or view our Privacy Policy and Terms of Use.
Cookie Settings
Cookies and similar technologies are used on this website for proper function of the website, for tracking performance analytics and for marketing purposes. We and some of our third-party providers may use cookie data for various purposes. Please review the cookie settings below and choose your preference.
Used for the proper function of the website
Used for monitoring website traffic and interactions
Cookie Settings
Cookies and similar technologies are used on this website for proper function of the website, for tracking performance analytics and for marketing purposes. We and some of our third-party providers may use cookie data for various purposes. Please review the cookie settings below and choose your preference.
Strictly Necessary: Used for the proper function of the website
Performance/Analytics: Used for monitoring website traffic and interactions
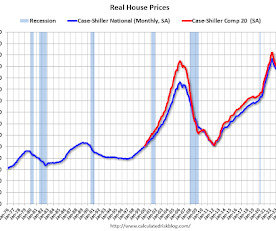
Below 2022 Peak Excerpt: It has been over 18 years since the housing bubble peak. below the recent peak in 2022. Today, in the Calculated Risk Real Estate Newsletter: Inflation Adjusted House Prices 1.1% The second graph shows the same two indexes in real terms (adjusted for inflation using CPI).
Below 2022 Peak Excerpt: It has been over 18 years since the bubble peak. below the recent peak in 2022. Today, in the Calculated Risk Real Estate Newsletter: Inflation Adjusted House Prices 1.4% The second graph shows the same two indexes in real terms (adjusted for inflation using CPI).
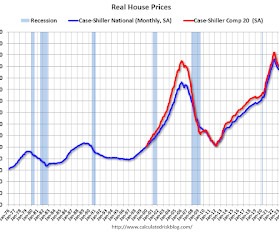
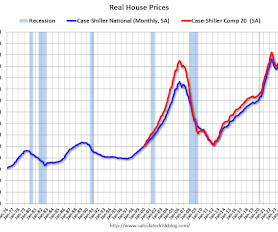
Below 2022 Peak Excerpt: It has been over 18 years since the bubble peak. below the recent peak in 2022. Today, in the Calculated Risk Real Estate Newsletter: Inflation Adjusted House Prices 1.5% The second graph shows the same two indexes in real terms (adjusted for inflation using CPI). Both indexes increased in August in real terms.
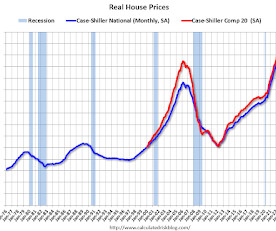
Below 2022 Peak Excerpt: It has been 19 years since the housing bubble peak, ancient history for many readers! below the recent peak in 2022. Today, in the Calculated Risk Real Estate Newsletter: Inflation Adjusted House Prices 1.7% The second graph shows the same two indexes in real terms (adjusted for inflation using CPI).
Speaker: Nancy Wu, Head of Sales and Customer Success at SkyStem
May 18, 2022 at 1pm EST Prerequisite: None. Advanced Preparation: None Required. Delivery Method: Group Internet-Based. Feedback and Comments: contact marketing@skystem.com or call 646-833-3177.
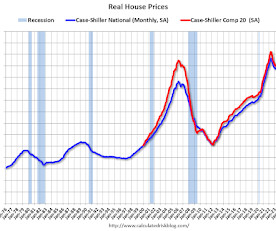
Below 2022 Peak Excerpt: It has been over 18 years since the housing bubble peak. below the recent peak in 2022. Today, in the Calculated Risk Real Estate Newsletter: Inflation Adjusted House Prices 0.8% The second graph shows the same two indexes in real terms (adjusted for inflation using CPI).
Below 2022 Peak Excerpt: It has been over 18 years since the housing bubble peak. below the recent peak in 2022. Today, in the Calculated Risk Real Estate Newsletter: Inflation Adjusted House Prices 0.8% The second graph shows the same two indexes in real terms (adjusted for inflation using CPI).
Below 2022 Peak Excerpt: It has been over 18 years since the housing bubble peak. below the recent peak in 2022. Today, in the Calculated Risk Real Estate Newsletter: Inflation Adjusted House Prices 1.0% The second graph shows the same two indexes in real terms (adjusted for inflation using CPI).
Below 2022 Peak Excerpt: It has been almost 19 years since the housing bubble peak, ancient history for some readers! below the recent peak in 2022. Today, in the Calculated Risk Real Estate Newsletter: Inflation Adjusted House Prices 1.0% The second graph shows the same two indexes in real terms (adjusted for inflation using CPI).
It’s never been easier for companies to recruit top-tier talent on a global scale, thanks to remote working apps, platforms, and social media. However, employees are now embracing lifestyle over work – with many migrating to other jobs to find new opportunities that better align with their values and priorities.
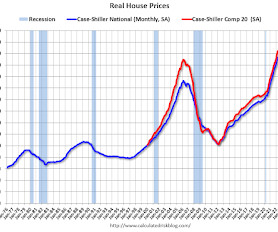
Below 2022 Peak Excerpt: It has been 18 years since the bubble peak. below the recent peak in 2022. Today, in the Calculated Risk Real Estate Newsletter: Inflation Adjusted House Prices 1.9% The second graph shows the same two indexes in real terms (adjusted for inflation using CPI). In real terms (using CPI), the National index is 1.9%
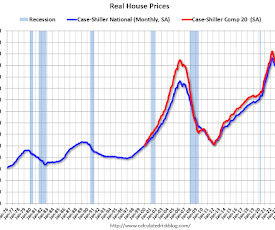
Below 2022 Peak Excerpt: It has been over 18 years since the bubble peak. below the recent peak in 2022. Today, in the Calculated Risk Real Estate Newsletter: Inflation Adjusted House Prices 1.5% The second graph shows the same two indexes in real terms (adjusted for inflation using CPI). Both indexes increased in July in real terms.
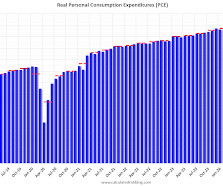
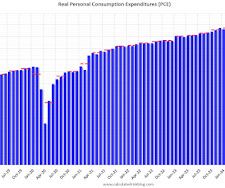
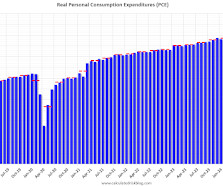
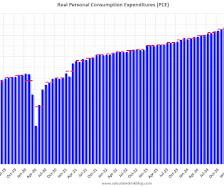
percent in June 2022. percent in February 2022. Real DPI increased 0.4 percent and real PCE increased 0.1 percent; goods increased less than 0.1 percent and services increased 0.2 emphasis added The October PCE price index increased 2.3 percent year-over-year (YoY), up from 2.1 percent YoY, up from 2.7
The Department of Labor rescinded its 2022 guidance cautioning against cryptocurrency in 401(k) plans, reaffirming a neutral stance on digital assets in retirement accounts.
The fintech industry is growing exponentially — in the first quarter of 2022, the sector saw a 182 percent increase in tech job growth. However, experts are warning that local candidates to fill those roles may become scarce in certain areas.
million in 2022, and 7.3 million in 2021 (2021 and 2022 were the two best years ever), but still a solid year for employment gains. in early 2022. 10) Housing Inventory: Housing inventory decreased sharply during the pandemic to record lows in early 2022. Will there be a recession in 2025? million jobs in 2024.
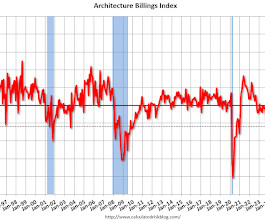
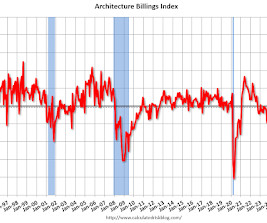
Firm billings have now decreased for the majority of firms every month except two since October 2022. In November, we saw the first positive score for multi-family since 2022. From the AIA: ABI December 2024: Business conditions end the year on a weak note The AIA/Deltek Architecture Billings Index (ABI) score fell to 44.1
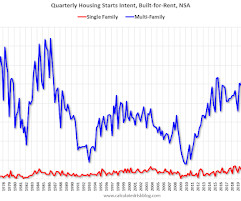
Although the majority of units built-for-rent are still multi-family (blue) - even after the sharp decline in 2022 - there has been a significant pickup in single family units started built-for-rent (red). The first graph shows the number of single family and multi-family units started with the intent to rent.
As we move through 2022, companies are eager to retain a competitive advantage and continue on the path of success and adaptability. Preparing for the unexpected and pivoting at a moment’s notice were valuable lessons many global companies learned in 2020 and 2021.
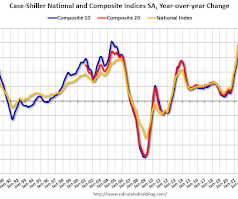
Below 2022 Peak • Freddie Mac House Price Index Increased in September; Up 3.6% . • Case-Shiller: National House Price Index Up 4.2% year-over-year in August • Fannie and Freddie: Single Family and Multi-Family Serious Delinquency Rates Increased in September • Inflation Adjusted House Prices 1.5%
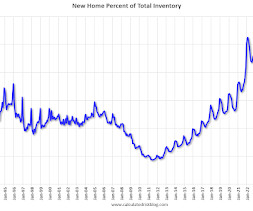
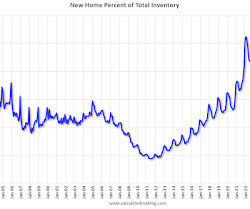
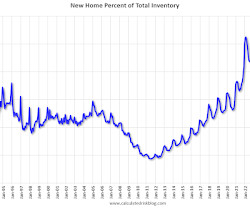
in December 2022. The following graph uses Not Seasonally Adjusted (NSA) existing home inventory from the National Association of Realtors (NAR) and new home inventory from the Census Bureau (only completed and under construction inventory). Then, with the pandemic, existing home inventory collapsed and now the percent of new homes is 22.4%
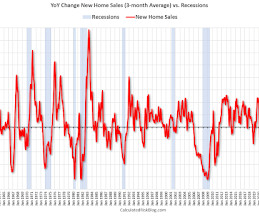
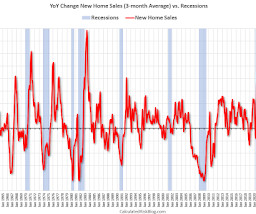
In 2022, both new home sales and single-family starts turned down in response to higher mortgage rates. The YoY change in new home sales in late 2022 and early 2023 suggested a possible recession. New home sales peaked in 2020 as pandemic buying soared.
Most notable was the strength of billings growth in the West, where the score was the highest it has been since mid-2022. This was first positive score for multi-family since August 2022. Although billings continued to decline at firms located in the Northeast and Midwest, the pace of the decline slowed in both regions this month.
Speaker: Marguerita Cheng - Chief Executive Officer at Blue Ocean Global Wealth
November 2nd, 2022 at 9:30 am PT, 12:30 pm ET, 5:30 pm BST Personal finance apps vs. professional money management. How FinTech is changing the industry. The importance of fostering inclusion and belonging in money management.
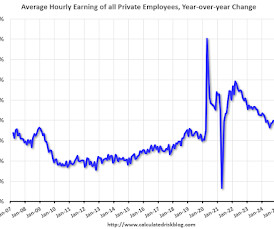
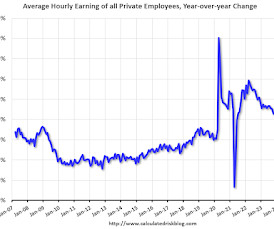
YoY in March 2022 and was at 3.9% and up from the lowest level on record (seasonally adjusted) in December 2022 (6.6%). There was a huge increase at the beginning of the pandemic as lower paid employees were let go, and then the pandemic related spike reversed a year later. Wage growth has trended down after peaking at 5.9%
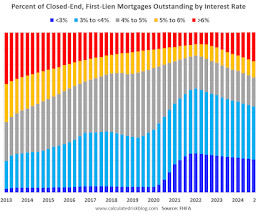
The percent of outstanding loans under 4% peaked in Q1 2022 at 65.1% (now at 53.4%), and the percent under 5% peaked at 85.6% (now at 71.3%). This shows the surge in the percent of loans under 3% starting in early 2020 as mortgage rates declined sharply during the pandemic.
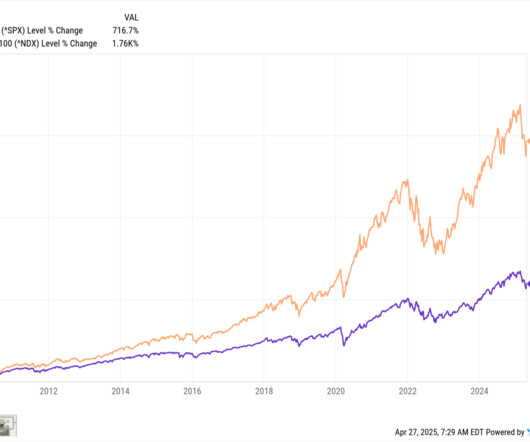
2022 down 18% for the year.4 What has developed over the entirety of the post-financial crisis era of rising equity markets and until 2022, falling or zero interest rates.The good news is that this is how you build wealth over the long haul. 2015 gain of only 1.4% -2018 drop of 4.4%, including a Q4 drop of nearly 20%. -Q1
The index has exceeded 60 percent for seven straight months, with the May and June readings the highest since November 2022 (69.4 percent in June, a 1.2-percentage percentage point decrease from May’s reading of 68.7 emphasis added This was at consensus expectations, but employment was weak and prices paid very high.
YoY in March 2022 and was at 3.7% and up from the lowest level on record (seasonally adjusted) in December 2022 (6.6%). There was a huge increase at the beginning of the pandemic as lower paid employees were let go, and then the pandemic related spike reversed a year later. Wage growth has trended down after peaking at 5.9%
percent in June 2022. percent in February 2022. Real DPI increased 0.1 percent in September and real PCE increased 0.4 percent; goods increased 0.7 percent and services increased 0.2 emphasis added The September PCE price index increased 2.1 percent year-over-year (YoY), down from 2.3 percent YoY, unchanged from 2.7
percent in June 2022. percent in February 2022. Excluding food and energy, the PCE price index increased 2.8 percent from one year ago. emphasis added The February PCE price index increased 2.5 percent year-over-year (YoY) , unchanged from 2.5 percent YoY in January, and down from the recent peak of 7.2 percent YoY , up from 2.7
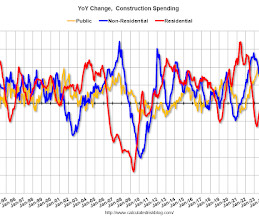
below the peak in 2022. This graph shows private residential and nonresidential construction spending, and public spending, since 1993. Note: nominal dollars, not inflation adjusted. Private residential (red) spending is 4.4% Private non-residential (blue) spending is 0.8% below the peak in February 2025. the peak the previous month.
in December 2022. It took a number of years following the housing bust for new home inventory to return to the pre-bubble percent of total inventory. Then, with the pandemic, existing home inventory collapsed and now the percent of new homes is 20.8% of the total for sale inventory, down from a peak of 27.2%
YoY in March 2022 and was at 4.0% and up from the lowest level on record (seasonally adjusted) in December 2022 (6.5%). There was a huge increase at the beginning of the pandemic as lower paid employees were let go, and then the pandemic related spike reversed a year later. Wage growth has trended down after peaking at 5.9%
below the peak in 2022. This graph shows private residential and nonresidential construction spending, and public spending, since 1993. Note: nominal dollars, not inflation adjusted. Private residential (red) spending is 4.2% Private non-residential (blue) spending is at a new peak. Public construction spending is 0.6%
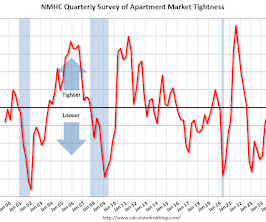
The Market Tightness Index came in at 52 this quarter above the breakeven level of 50 for the first time since July 2022 indicating tighter market conditions.
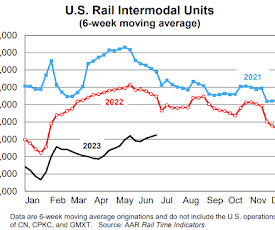
in June 2023 from June 2022 , their first decline in three months. million) were up 0.6% (32,547( carloads) over the same period in 2022 and were the highest since 2019. decline from June 2022 was their 16th straight. Carloads in 2021, 2022 and 2022: Total originated carloads (which don’t include intermodal) on U.S.
In 2022, both new home sales and single-family starts turned down in response to higher mortgage rates. The YoY change in new home sales in late 2022 and early 2023 suggested a possible recession. I dismissed it when the yield curve inverted in 2019 and again in 2022. New home sales peaked in 2020 as pandemic buying soared.
in December 2022. It took a number of years following the housing bust for new home inventory to return to the pre-bubble percent of total inventory. Then, with the pandemic, existing home inventory collapsed and now the percent of new homes is 25.1% of the total for sale inventory, down from a peak of 27.2%
percent in June 2022. percent in February 2022. Personal saving was $843.2 billion in December and the personal saving ratepersonal saving as a percentage of disposable personal incomewas 3.8 emphasis added The December PCE price index increased 2.6 percent year-over-year (YoY), up from 2.4 percent YoY, unchanged from 2.8
percent in June 2022. percent in February 2022. Excluding food and energy, the PCE price index increased 2.6 percent from one year ago. emphasis added The March PCE price index increased 2.3 percent year-over-year (YoY) , down from 2.7 percent YoY in February, and down from the recent peak of 7.2 percent YoY , down from 3.0
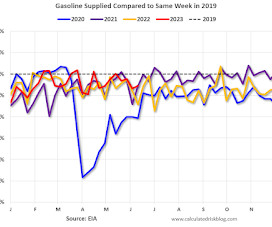
I stopped the weekly updates of high frequency indicators at the end of 2022. This data shows the 7-day average of daily total traveler throughput from the TSA for 2019 (Light Blue), 2020 (Black), 2021 (Blue), 2022 (Orange) and 2023 (Red). Black is 2020, Blue is 2021 and Red is 2022. This data is as of June 25th.
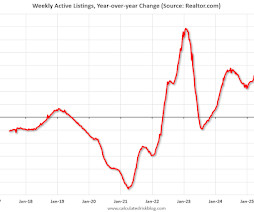
Last week boasted the highest number of new listings since mid-2022. New listings were the highest since 2022. The momentum from earlier this spring is still going strong, pointing to a lively market heading into late spring and early summer. The median list price was up 0.9% year-over-year.
We organize all of the trending information in your field so you don't have to. Join 36,000+ users and stay up to date on the latest articles your peers are reading.
You know about us, now we want to get to know you!
Let's personalize your content
Let's get even more personalized
We recognize your account from another site in our network, please click 'Send Email' below to continue with verifying your account and setting a password.


Let's personalize your content