This site uses cookies to improve your experience. To help us insure we adhere to various privacy regulations, please select your country/region of residence. If you do not select a country, we will assume you are from the United States. Select your Cookie Settings or view our Privacy Policy and Terms of Use.
Cookie Settings
Cookies and similar technologies are used on this website for proper function of the website, for tracking performance analytics and for marketing purposes. We and some of our third-party providers may use cookie data for various purposes. Please review the cookie settings below and choose your preference.
Used for the proper function of the website
Used for monitoring website traffic and interactions
Cookie Settings
Cookies and similar technologies are used on this website for proper function of the website, for tracking performance analytics and for marketing purposes. We and some of our third-party providers may use cookie data for various purposes. Please review the cookie settings below and choose your preference.
Strictly Necessary: Used for the proper function of the website
Performance/Analytics: Used for monitoring website traffic and interactions
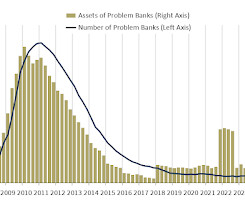
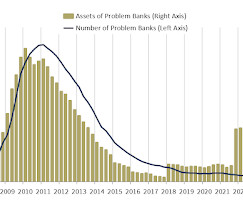
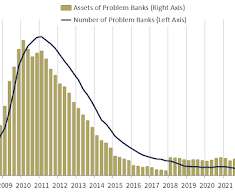
From the FDIC: The number of banks on the FDIC’s “Problem Bank List” increased from 52 to 63. This graph from the FDIC shows the number of problem banks and assets at problem institutions. This graph from the FDIC shows the number of problem banks and assets at problem institutions. Total assets held by problem banks rose $15.8
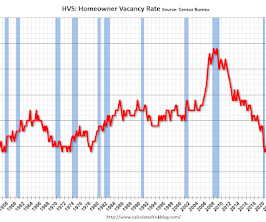
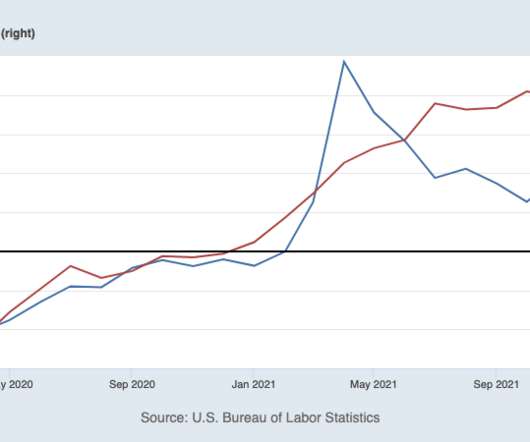
This survey might show the trend, but I wouldn't rely on the absolute numbers. Once again - this probably shows the general trend, but I wouldn't rely on the absolute numbers. in 2021 and 2022 and at the highest level since 2018. However, there are serious questions about the accuracy of this survey. in Q1 from 6.9%
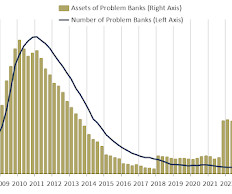
The FDIC reported the number of problem banks was unchanged at 43. The number of FDIC-insured institutions declined from 4,672 in first quarter to 4,645 this quarter. The number of banks on the FDIC’s “Problem Bank List” remained unchanged at 43. During the quarter, two banks opened, one bank failed, and 27 institutions merged.
The FDIC reported the number of problem banks was unchanged at 40. The number of FDIC-insured institutions declined from 4,796 in first quarter 2022 to 4,771. The number of banks on the FDIC’s “Problem Bank List” remained unchanged from first quarter at 40, the lowest level since QBP data collection began in 1984.
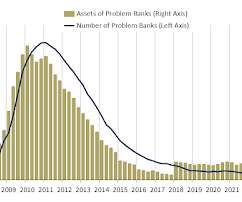
The FDIC reported the number of problem banks decreased to 39. The number of FDIC-insured institutions declined from 4,746 in third quarter to 4,706 this quarter. The number of banks on the FDIC’s “Problem Bank List” decreased by 3 from third quarter to 39, the lowest level in QBP history. Seven institutions ceased operations.
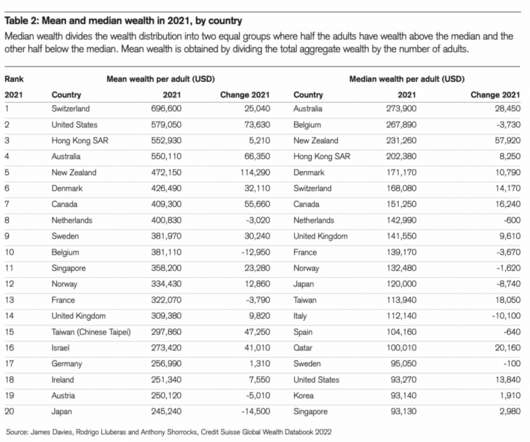
The actual data had some very interesting highlights, including some ginormous numbers: -Global Wealth: $463.6 The 5-year outlook is global wealth will increase by $169 trillion by 2026; by 2024, global wealth per adult should pass $100,000 and the number of millionaires will exceed 87 million individuals over the next five years.
Consider these columns going back to 2013 pointing out the foolishness of tax-payer subsidized corporate welfare queens (2013), and why median wages were rising ( 2016 , 2017 , 2018 , 2018 , 2019 ). By any measure, we still have an enormous number of unfilled positions. Then came the pandemic, and a huge federal worker subsidy.
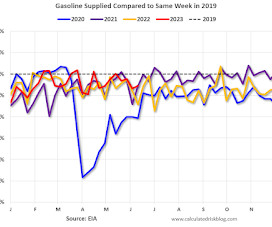
Here is a mid-year look at four indicators: -- Airlines: Transportation Security Administration -- The TSA is providing daily travel numbers. Dashed purple is for 2018, the record year for hotel occupancy. I stopped the weekly updates of high frequency indicators at the end of 2022. This data is as of June 25th.
The FDIC reported the number of problem banks increased to 42. The number of banks on the FDIC’s “Problem Bank List” increased by two from second quarter to 42. This graph from the FDIC shows the number of problem banks and assets at problem institutions. emphasis added Click on graph for larger image. billion to $163.8
Here is a late September look at four indicators: -- Airlines: Transportation Security Administration -- The TSA is providing daily travel numbers. Dashed purple is for 2018, the record year for hotel occupancy. I stopped the weekly updates of high frequency indicators at the end of 2022. This data is as of September 24th.
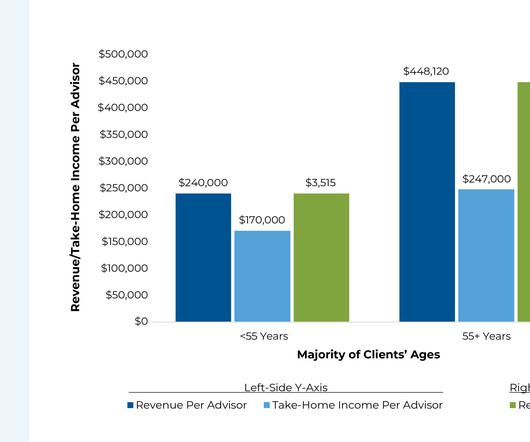
Though, at some point, covering a large number of financial planning topics can eat into an advisor's time, which is problematic if clients won't pay substantially more to receive that more comprehensive advice. In addition, advisors could reduce the amount of time they spend on plan development by bringing on staff assistance (e.g.,
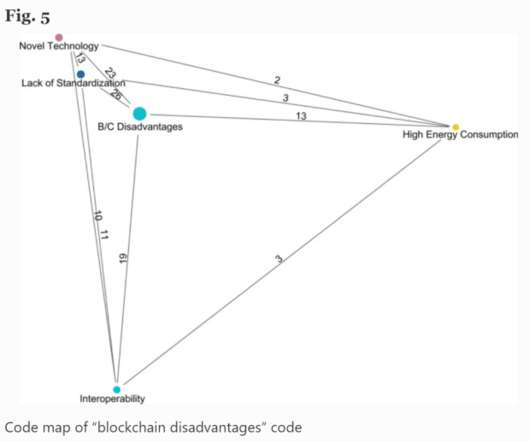
Blockchain Scrapheap The Tech Monitor reports IBM and Maersk Scrap Blockchain Trade Platform TradeLens IBM and logistics company Maersk have called time on TradeLens, the blockchain-backed supply chain platform that came online for the first time in 2018, citing a “lack of global industry collaboration” for its demise.
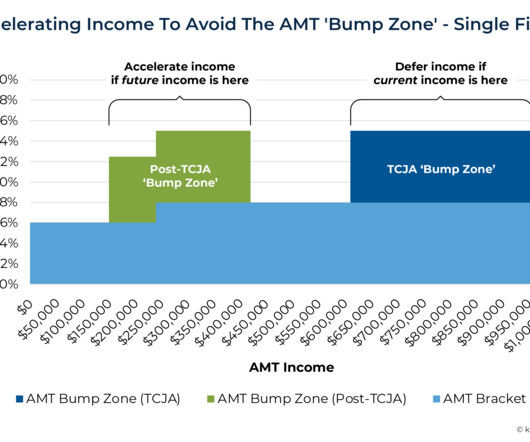
Since the Tax Cuts & Jobs Act (TJCA) was passed in 2017, few households have been subject to the Alternative Minimum Tax (AMT), which TCJA restructured so that it applied mainly to a select number of upper-income households.
Here is a late July look at four indicators: -- Airlines: Transportation Security Administration -- The TSA is providing daily travel numbers. Dashed purple is for 2018, the record year for hotel occupancy. I stopped the weekly updates of high frequency indicators at the end of 2022. This data is as of July 23rd.
As 2023 comes to a close, I am once again so thankful to all of you, the ever-growing number of readers who continue to regularly visit this Nerd's Eye View Blog (and share the content with your friends and colleagues, which we greatly appreciate!). We recognize (and appreciate!)
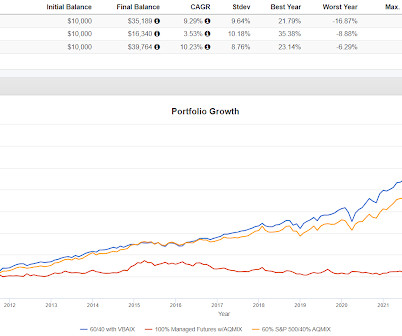
Looking at AQMIX on your statement kind of going nowhere for 10 years could be difficult but clearly a portfolio with the allocation in Portfolio 3 would have kept up just fine and if they had focused on the bottom line number and not the line items, it would not have been difficult. It only back tests to 2018 but here's what you get.
April inflation data confirmed there is no need to panic about the first-quarter numbers. That’s the slowest pace since August 2021 and not far above the 2018-2019 average of 3.6%. but well above the 2018-2019 average of 3.2%. New highs scare many investors, but history suggests more new highs will follow.
As 2022 comes to a close, I am once again so thankful to all of you, the ever-growing number of readers who continue to regularly visit this Nerd’s Eye View Blog (and share the content with your friends and colleagues, which we greatly appreciate!).
Meaning, you do not get the 8-10% long-term gains without living through a significant number of market events, ranging from cyclical drawdowns to longer secular bear markets, and full-on crashes. 2000-13 : Secular bear market did not make new highs until March 2013 2018 : ~20% pullback as the economy slowed, FOMC hiked.
The offering comes from Innovator Capital Management, which launched the first so-called buffer ETFs, also sometimes referred to as defined-outcome funds, in 2018.” – Bloomberg Let’s get this out of the way: I dislike any product that exchanges a portion of your potential gains in exchange for downside protection.
year over year • September marked the fourth consecutive year-over-year rise in mortgage delinquencies, the longest such stretch since early 2018 outside of the initial impact of the COVID pandemic • A 5.9% from August and 5.7% increase from the month prior and up +43.2% from last September emphasis added Click on graph for larger image.
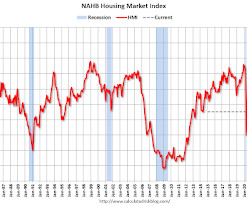
Any number above 50 indicates that more builders view sales conditions as good than poor. High mortgage rates are clearly taking a toll on builder confidence and consumer demand, as a growing number of buyers are electing to defer a home purchase until long-term rates move lower,” said NAHB Chief Economist Robert Dietz.
So what were the numbers like after World War 1 and after World War 2? Jeff Hirsch : The numbers, it was about just around 500 percent, 517%, 521%, right in the just over 500%. And the Dow didn’t actually hit that number until, uh, it was July of 1992, but the S&P had the 500 percent move-in. Q4 2018, 19.9%.
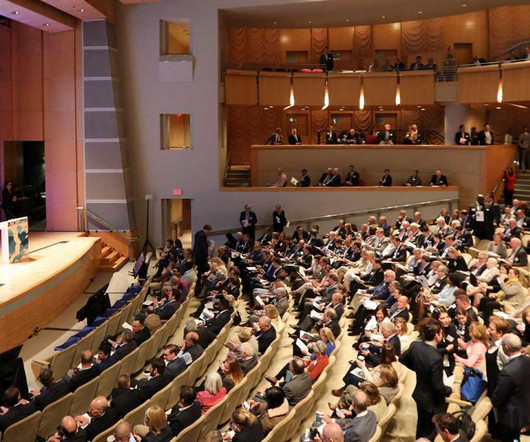
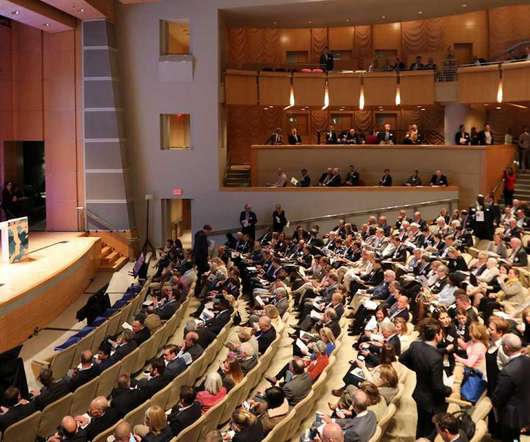
NOW 2018 | What Makes a Great Leader? achen Thu, 05/31/2018 - 09:49 What do the Magna Carta, the Washington Monument and giant pandas have in common? He was an early signatory of the Giving Pledge, a commitment from a growing number of extremely wealthy individuals to donate a majority of their wealth to charity.
NOW 2018 | What Makes a Great Leader? Thu, 05/31/2018 - 09:49. During the NOW 2018 conference, Rubenstein and Brown Advisory CEO Mike Hankin engaged in a rapid-fire conversation that covered Rubenstein’s thoughts on a wide range of topics, from the Founding Fathers to Facebook and Twitter.
NOW 2018 | The Global Refugee Crisis. Wed, 05/30/2018 - 17:06. According to the United Nations, more than 65 million people are currently forcibly displaced from their homes, a larger number than at any time since World War II. The world currently faces one of the most tragic humanitarian crises in modern history.
NOW 2018 | China and the Race for Artificial Intelligence achen Thu, 05/31/2018 - 09:20 The advent of artificial intelligence (AI) is one of the top technology stories in recent years. Not surprisingly, AI has also permeated public policy discussions, especially with the U.S.
NOW 2018 | China and the Race for Artificial Intelligence. Thu, 05/31/2018 - 09:20. The race is on to lead the world in AI innovation, and a panel of experts at NOW 2018 offered insight on the competitive dynamics between the two global superpowers driving progress in AI.
The Bitcoin hype cooled in 2018, resulting in significant declines—its lowest value was around $3,232 in December of that year. on August, 3rd, 2018, and its value climbed to $29,310.44 5 years (2018-2023) $7,438.67 $29,310.44 Initial Price Number of Bitcoins purchased Final Value 10 years (2013-2023) $13.30
Monthly numbers can be noisy and so a 3-month average is helpful. The hiring rate, which is the number of hires as a percent of the labor force, has fallen to 3.3%, the slowest pace since 2013 (outside of the Covid months). in 2018-2019. in 2018-2019). The economy created over 2 million jobs in 2024, down from 2.4
GM stopped reporting monthly sales in 2018, taking a page from electric-vehicle maker Tesla Inc. TSLA Tesla reported sales and production numbers on Sunday, with analysts worrying about potential price cuts. Shares of GM dropped more than 1% Monday, poised to snap a three-session winning streak.
Although a number of these provisions will negatively impact taxpayers starting in 2026, there a few changes that will be positive. In 2018, the brackets dropped to 10%, 12%, 22%, 24%, 32%, 35%, and 37%. In recent years, a number of states developed a sort of workaround for business owners to navigate the SALT cap.
NOW 2018 Conference: Our Investment Team’s Roundtable Recap achen Thu, 06/14/2018 - 10:27 The NOW conference is always memorable, but this year’s conference included some particularly compelling and provocative ideas. A good number of attendees recoiled in displeasure and an equivalent number perked up eagerly.
NOW 2018 Conference: Our Investment Team’s Roundtable Recap. Thu, 06/14/2018 - 10:27. A good number of attendees recoiled in displeasure and an equivalent number perked up eagerly. but a number of folks were quite optimistic about anticipated progress. The cost for the self-driving systems are declining rapidly.
He’s written numerous books on the subject, including Damodaran on Valuation, Narrative and Numbers, and the textbook Investment Valuation Tools and Techniques for Determining the Value of Any Asset. purely by luck in 2018. I’m not saying intrinsic value is somehow a stable stagnant number.
In 2018–2019, diesel consumption stood at 2.64 And when it comes to fuel bills, in 2018–2019, they were Rs 18,587.14 And when it comes to fuel bills, in 2018–2019, they were Rs 18,587.14 Going back to 5 years, only 40% of the railway tracks were electrified, but now that number has risen to 85%. lakh kL in 2020–21.
2018 Berkshire Hathaway Annual Shareholder Meeting ajackson Wed, 08/01/2018 - 09:30 The Berkshire Hathaway annual meeting is an opportunity for shareholders and analysts to pose questions to Warren Buffett and Charlie Munger. That can work for a while and sometimes climbs to extraordinary numbers, but it comes to a bad ending.
2018 Berkshire Hathaway Annual Shareholder Meeting. Wed, 08/01/2018 - 09:30. Berkshire’s investment portfolio holds about $186 billion in equities and $118 billion in cash equivalents and bonds as of March 31, 2018. That can work for a while and sometimes climbs to extraordinary numbers, but it comes to a bad ending.
Goldilocks Job Numbers as Economy Powers Ahead The December payroll report was strong on the surface, with 216,000 jobs created last month and the unemployment rate firm at 3.7%. In fact, the average annual number of jobs gained from 2010-2019 was 2.2 Another 20% gain is possible, however, as it has happened before four times.
2018-19 7.04 -1.87 As we know from the data of previous years the margins are not stable due as their earnings were dependent on the number of contracts. Net Profit (Cr.) 2022-23 350.96 2021-22 161.5 2020-21 12.98 -2.37 2019-20 5.68 -3.18 in FY23 as compared to 34.08% in FY22. in FY22 to 0.46 Average (5 Years) 2.52
The 1987 crash was partly attributed to selling portfolio insurance and there was the so called Volmageddon of 2018. 2018 was not 1987 and if there is another event where volatility ends up being a major determent then it will be different than the other two but with some overlap. Events don't repeat but the can rhyme.
The economy created 227,000 jobs in November, close to expectations, which somewhat made up for the low 36,000 number in October (revised up from 12,000). 6 million level we saw in 2018-2019. million level we saw in 2018-2019. The other aspect that is concerning is that overall hiring has slowed, a lot. Hires fell to 5.3
made this kind of switch between 2006 and 2018. Those kinds of numbers can be very attractive to investors; the study revealed that those funds that switch indexes rake in $70 million more new money on average over the next 5 years, even though the performance didn’t actually improve. better in a 1-year period, 2.4%
We organize all of the trending information in your field so you don't have to. Join 36,000+ users and stay up to date on the latest articles your peers are reading.
You know about us, now we want to get to know you!
Let's personalize your content
Let's get even more personalized
We recognize your account from another site in our network, please click 'Send Email' below to continue with verifying your account and setting a password.


Let's personalize your content