This site uses cookies to improve your experience. To help us insure we adhere to various privacy regulations, please select your country/region of residence. If you do not select a country, we will assume you are from the United States. Select your Cookie Settings or view our Privacy Policy and Terms of Use.
Cookie Settings
Cookies and similar technologies are used on this website for proper function of the website, for tracking performance analytics and for marketing purposes. We and some of our third-party providers may use cookie data for various purposes. Please review the cookie settings below and choose your preference.
Used for the proper function of the website
Used for monitoring website traffic and interactions
Cookie Settings
Cookies and similar technologies are used on this website for proper function of the website, for tracking performance analytics and for marketing purposes. We and some of our third-party providers may use cookie data for various purposes. Please review the cookie settings below and choose your preference.
Strictly Necessary: Used for the proper function of the website
Performance/Analytics: Used for monitoring website traffic and interactions
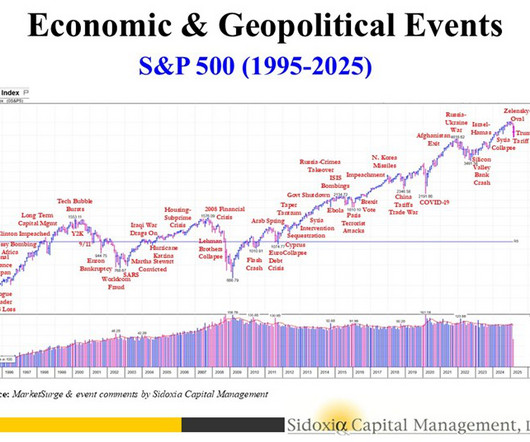
Following the long run-up in the US equity markets since the bottom of the 2008–2009 financial crisis, many investors with taxable investment accounts have likely found themselves with high embedded gains in their portfolios. While the gains signal portfolio growth, they also create challenges for ongoing management.
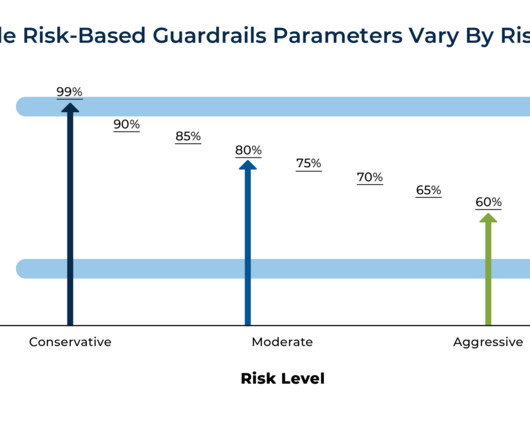
HiMaVs leverage the brain's natural preference for narrative and visual information by showing how a retirement income plan – such as a risk-based or guardrails-based strategy – would have fared during actual historical periods like the Great Depression, Stagflation of the 1970s, or the 2008 Global Financial Crisis.
A 10-stock portfolio based on his criteria returned 79.2% over five years from 2003-2008, nearly quadrupling the S&P 500’s gain. The portfolio maintained a beta of roughly 1.0, The Strategy in Practice Our testing of Dreman’s approach demonstrates its effectiveness.
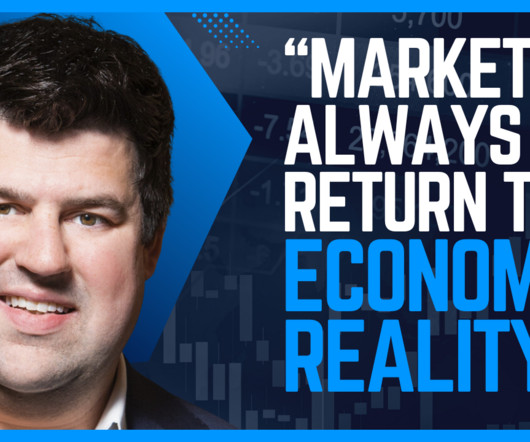
Elliott’s decade of experience leading research at one of the world’s premier hedge funds provides a rare window into institutional-level thinking that individual investors can apply to their own portfolios. He explains why claims of “this time it’s different” rarely hold true over longer time horizons.
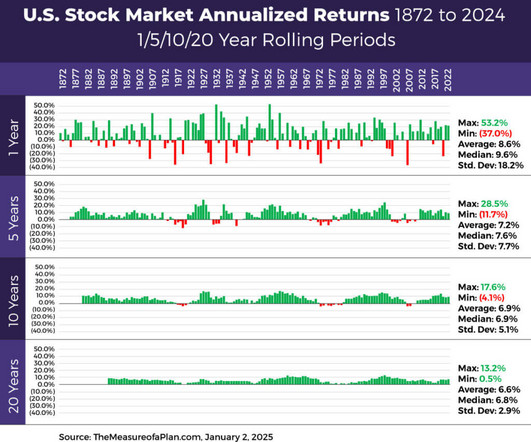
If you got unlucky in 2008 trying to time the market and you were down 39%, it is very difficult emotionally speaking to reverse course and try to time the market by buying. For instance, since 1950 the S&P 500 has seen calendar year returns vary from 47% up to 39% down. This is where the human psychology component comes into play.
RIA Edge Podcast: Schwab’s Jalina Kerr on How Resilient RIAs Can Turn Market Volatility Into Growth RIA Edge Podcast: Schwab’s Jalina Kerr on How Resilient RIAs Can Turn Market Volatility Into Growth Jalina Kerr of Charles Schwab shares how the most adaptive firms are expanding beyond portfolio management, into areas like estate and tax planning.
During times of economic, financial, and political uncertainty, investors often wonder where to invest or what changes to make to their portfolio. The chart below shows what happened to fixed income (bonds) in 2008. The returns are normalized total returns of various bond indices during the 2008 -2009 financial crisis.
Investors looking for a diversified portfolio that performs well in all market conditions have long been drawn to the All Weather Portfolio, a strategy pioneered by Ray Dalio of Bridgewater Associates. The portfolio allocates across U.S. 2008 -0.4% -21.0% 2008 -0.4% -21.0% GLD SPDR Gold Shares 7.5% +380.3%
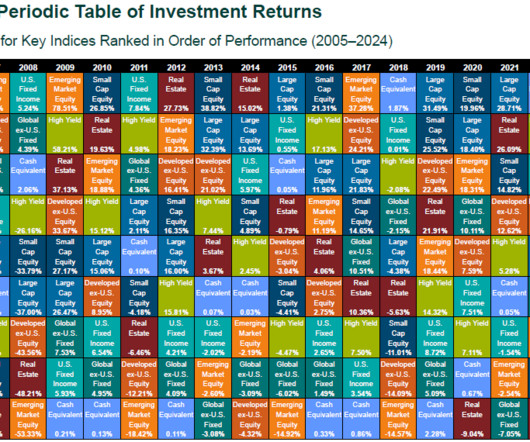
The top 10 weight today for the large value index (17.3%) is almost exactly half of its prior peak (34.5%) in late 2008. Data for Panel A and Panel B from 3/1/2008 12/31/2024. 3 So, as investors, what can we do about it within our portfolios? Data from 12/31/1989 12/31/2024. Source: Morningstar. Source: Morningstar.
To help us unpack this and what it means for your portfolio, let’s bring in Matt Hougan. Bitcoin broke through that in 2008, 2009, and it’s been gaining steady adoption. I’m Barry Ritholtz. And on today’s edition of At The Money, we’re going to discuss all sorts of cryptocurrencies.
To help us unpack all of this and what it means for your portfolio, let’s bring in Matt Hogan. And the second, is you need to size your portfolio appropriately. If I’m an investor and I want to put 2 or 3% of my portfolio into coins, what do I do? Let’s start with just the basics, Matt.
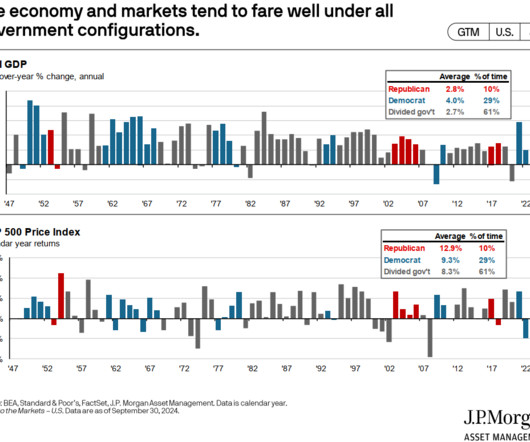
But don’t vote with your portfolio as your portfolio is going to be agnostic to politics in the long-run. For example, the economic impact of policies in 2008 and 2009 have a much bigger impact than policies enacted in 2012. 1 So get out there and vote.
If your parents or grandparents experienced the Great Depression or the 2008 financial crisis, you might have inherited a powerful aversion to risk. As Will points out, studies have shown that people feel losses in their portfolio twice as much as they feel the gain. 19:50] Maximize equities in a portfolio for high returns. [20:39]
The Downside of Missing the Market’s Best Days It is natural to wonder if you should change your portfolio during such times. Think of investors who sold during the financial crisis of 2008-09, only to miss one of the strongest bull markets in history. A diversified portfolio is designed to help manage risk during market cycles.
This is why having a globally diversified portfolio can benefit US-centric investors, as the US won’t always lead. Other years that saw big returns after down days were 2003, 2008, 2009, 2020, and of course now. A diversified portfolio does not assure a profit or protect against loss in a declining market.
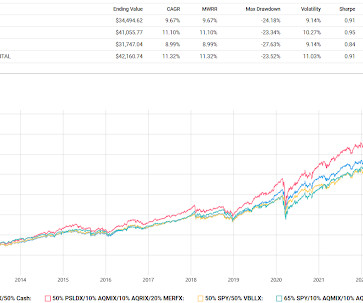
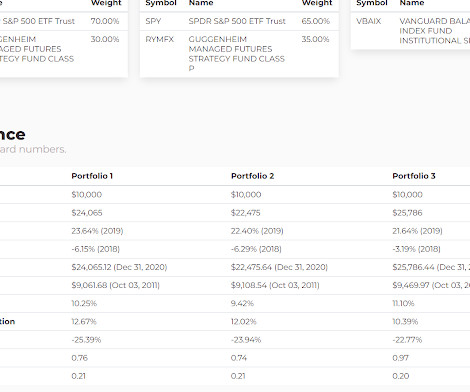
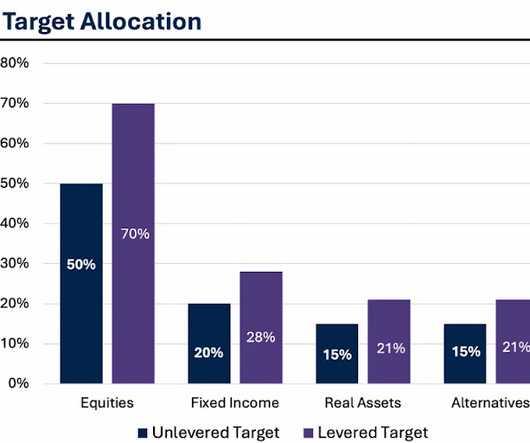
The idea is that you get the full beta (stocks and bonds) return with just a portion of the portfolio often with futures or some other form of leverage, leaving dollars left over to add alternatives all in pursuit of better nominal returns or better risk adjusted returns. The fourth portfolio more closely aligns with what we do here.
Those other times we saw fear similar to this were times like the recession and near bear market of 1990, October 2008 and March 2009 during the Great Financial Crisis, and the end of the bear market in 2022. A diversified portfolio does not assure a profit or protect against loss in a declining market. Heres the catch.
On December 24, 2008, the Dow Jones was down 1000 points and then on December 26th it was up 1000 points but of course that market event still had several months to go. Yes, idiosyncratic risk galore but someone who implemented Portfolio 1 on day one of APED, is down 2.5% The history of huge up days during events like this isn't great.
The last time the S&P 500 fell more than 1% in November was in 2008, and it has been higher 11 of the past 12 years. A diversified portfolio does not assure a profit or protect against loss in a declining market.
It is the most for a Republican President since 1988, but it trails the 365 (2008) and 332 (2012) President Obama won in his two elections. A diversified portfolio does not assure a profit or protect against loss in a declining market. President Trump is projected to win 312 electoral votes compared with Vice President Harris’s 226.
Model Performance & Return History Since its inception on Validea in 2003, the 20-stock, monthly rebalanced Peter Lynch-based portfolio has delivered a 1,142.0% 26.9%) Bottom 3 Worst-Performing Years: 2008 : -33.6% (vs. This nuanced, category-specific approach gives the model flexibility while remaining true to Lynchs principles.
While both track major indexes and serve as core holdings in countless portfolios, the similarities stop there. Using Portfolio Visualizer data from 2000 to May 2025, QQQ outperformed SPY slightly with a 7.77% annualized return vs. 7.52%. 2008 Crisis -50.8% -49.7% large-cap market and acts as a core portfolio holding.
We spend a lot of time here on how to diversify to try to smooth out the ride and how to hold up better when markets have a year like 2022 or 2008. This brings us to the heart of today's post about trying to build a set but don't completely forget portfolio. For us, that includes alternatives.
Small Cap Growth Models Risk and Return Stats Since 2003, the ten stock, tax efficient portfolio has delivered a 13.5% This strategy had big winning years like 2013 (+65.9%) , 2020 (+106.5%) , and 2021 (+51.7%) but also suffered steep declines, including 2008 (-27.0%) , 2011 (-16.7%) , 2015 (-9.6%) , and 2022 (-30.3%).
How did that background help when it comes to modeling portfolios or applying those methods of statistical analysis to investing? First of all, my, some of my co-portfolio managers will bristle if you refer to us as a factor based firm. Same number of shares is just gonna be, you know, 0.001 of the portfolio.
As is often the case for this subject, someone talked about building a dividend portfolio and living off the dividends. The yields of Portfolios 1 and 2 are now higher than SCHD due primarily to XYLD having a higher payout than it used to. The two portfolios built above tried to add a better CAGR than just going SCHD.
Their focus is on generating alpha with high conviction concentrated portfolios. As you, as you may recall, the insurance companies had huge commercial loan portfolios in those days that they were using to backstop long dated life insurance liabilities. So 2008, you know, as you remember, Barry fourth quarter was chaotic.
There's no way to fit that many into a portfolio without having a portfolio of diversifiers hedged with a little bit of equity exposure which I don't think would be optimal. And since the other funds came along, RYMFX has shown to not be such a great representation of the strategy even though it helped in 2008.
Since its inception on Validea in 2003, the models 10-stock, annually rebalanced portfolio has returned 825% , outperforming the S&P 500 by 361.8%. This portfolio is set to be rebalanced in June 2025, so you can follow the portfolio by accessing Validea today. Returns are model returns and do not reflect actual trading.
The ETF structure then evolved with the advent of active ETFs in 2008, the first one coming out of Bear Stearns, which went under that same year. John Davi, CEO and founder, Astoria Portfolio Advisors, encouraged advisors to use passive strategies in areas that can’t be beat. soon followed in 1993 with the SPDR S&P 500 Trust (SPY).
My Portfolio Guide, LLC was the first investment firm to publish a March Madness investing bracket where we share our picks and match them up against each other. With a strong, diversified portfolio, Amazon is poised to continue its dominance through 2025, claiming victory in this years March Madness Investing Bracket.
Notably, there was no SCR in 2000 and 2008, not the best times for investors, and potentially a major warning that something wasnt right. For one thing, PCE inflation is elevated right now because of lagging shelter data and financial services (thanks to portfolio management services inflation driven by higher stock prices).
2008) In October 2008, the Time magazine cover encapsulated the zeitgeist of the period with a 1929 photo that included a line of desperate people waiting for food donations at a soup kitchen. Diversify Your Investments: A well-balanced portfolio across asset classes helps reduce panic. Are you near retirement?
You would offer three of their stock picks where they were probably touting stocks they wanted to unload from their portfolio. 00:12:41 [Speaker Changed] If nothing in your portfolio is performing badly, you’re not diversified. And the managers you selected were all based on past performance. That’s exactly right.
The best way to help protect your investments from market volatility is through robust portfolio construction and diversification. Rather than reacting to negative market news, you should strategically position your portfolio to limit losses and reduce fluctuations in investment returns without sacrificing too much potential gain.
Our client portfolio managers explain how we deliver an outstanding client experience. Proactive, high-touch client experience: Communication and transparency. Proactive communication and transparency, especially during challenging times, can have a significant impact on your results. View transcript Close transcript Dale K.
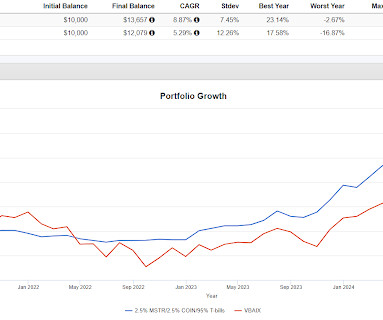
The best example of this that I can think of to make the point was in the fall of 2008 when one day, the Dow fell 1000 points and then the next day it made it most of it back. Both portfolios have higher returns and lower standard deviations than PRPFX and VBAIX. Portfolio 2, the one with managed futures, was up 2.77%.
That’s one reason why the 2008–2009 recession was as bad as it was—households were much more levered and when unemployment rose and home prices fell, everything crashed. The greater the leverage, the harder the crash (like in 2008-2009). It was 101% at the end of 2019, and 137% just before the financial crisis in 2007.
But in 2008 in the financial crisis, I turned 50. And fire extinguishers were positions we would take in the portfolio that we could pull off the wall and put out the fire in the portfolio. And to continue with that, your portfolio follows that sound and crashes on the rocks if you want the mythology example.
Founded in 2008 (originally as IIFL Wealth Management), it specializes in financial services such as wealth management, asset management, portfolio management, corporate treasury solutions, and lending. The company serves high-net-worth individuals, family offices, and institutional clients.
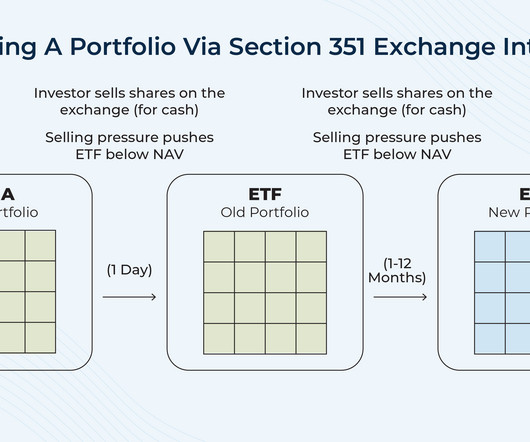
If you have a taxable portfolio of at least $1 million where selling or rebalancing would hit very hard tax-wise, you can exchange your portfolio for shares in a 351 ETF. We build portfolios here all the time with similar return profiles but with less volatility. 351's are kind of like 1031 exchanges in real estate.
2010–2015: Business investment and dividends drove profit growth, overcoming the drag from the reduction in government spending (which started to fall after the 2008–09 recession). Want to know more about what this could mean for your portfolio for the rest of the year? Still, it can explain a lot.
The top performing Zweig-inspired portfolio on Validea is the 20 stock, tax efficient portfolio. Since 2003, this portfolio has returned 1,113.1% , outperforming the market by 642.2%. Its best year was 2013 , when the portfolio returned +57.1% , far outpacing the S&P 500s +29.6% gains, respectively.
We organize all of the trending information in your field so you don't have to. Join 36,000+ users and stay up to date on the latest articles your peers are reading.
You know about us, now we want to get to know you!
Let's personalize your content
Let's get even more personalized
We recognize your account from another site in our network, please click 'Send Email' below to continue with verifying your account and setting a password.


Let's personalize your content