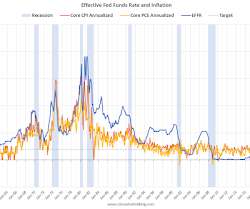
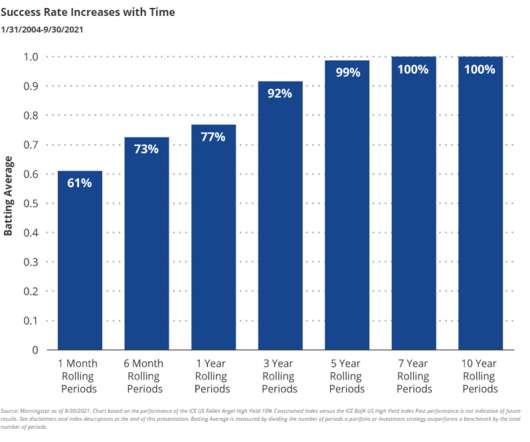
Effective Fed Funds Rate and Inflation
Calculated Risk
JANUARY 15, 2023
This graph shows the Effective Fed Funds Rate (blue) since 1958. The graph shows two measures of inflation using a month-over-month change annualized (using a three-month average to smooth the graph). For example, for December 2022, I used an average of December, November and October 2022, divided by the average of November, October and September 2022.


Let's personalize your content