This site uses cookies to improve your experience. To help us insure we adhere to various privacy regulations, please select your country/region of residence. If you do not select a country, we will assume you are from the United States. Select your Cookie Settings or view our Privacy Policy and Terms of Use.
Cookie Settings
Cookies and similar technologies are used on this website for proper function of the website, for tracking performance analytics and for marketing purposes. We and some of our third-party providers may use cookie data for various purposes. Please review the cookie settings below and choose your preference.
Used for the proper function of the website
Used for monitoring website traffic and interactions
Cookie Settings
Cookies and similar technologies are used on this website for proper function of the website, for tracking performance analytics and for marketing purposes. We and some of our third-party providers may use cookie data for various purposes. Please review the cookie settings below and choose your preference.
Strictly Necessary: Used for the proper function of the website
Performance/Analytics: Used for monitoring website traffic and interactions
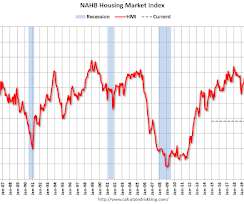
From the NAHB: Builder Sentiment at Third Lowest Reading Since 2012 In a further sign of declining builder sentiment, the use of price incentives increased sharply in June as the housing market continues to soften. The National Association of Home Builders (NAHB) reported the housing market index (HMI) was at 32, down from 34 last month.
in March, the lowest rate of appreciation since the spring of 2012. From CoreLogic: CoreLogic: March US Annual Home Price Growth Dips to Lowest Rate in More Than a Decade CoreLogic®. today released the CoreLogic Home Price Index (HPI™) and HPI Forecast™ for March 2023. home price growth fell to 3.1%
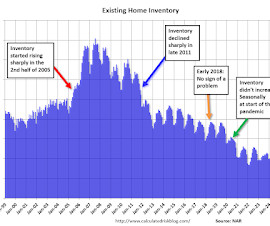
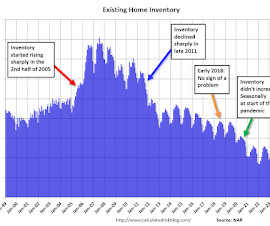
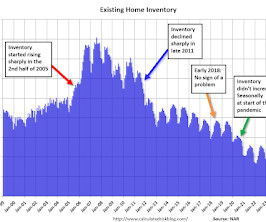
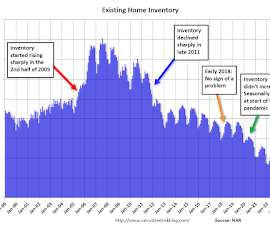
Several years later, in early 2012, when many people were still bearish on housing, the plunge in inventory in 2011 (blue arrow on graph below) helped me call the bottom for house prices in early 2012 (see The Housing Bottom is Here ). There is much more in the article.
This is the lowest confidence reading since August 2012, with the exception of the onset of the pandemic in the spring of 2020. This was well below the consensus forecast, and the lowest level since 2012 (excluding the two-month drop at the beginning of the pandemic). emphasis added Click on graph for larger image.
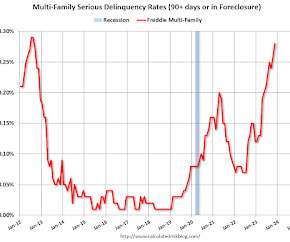
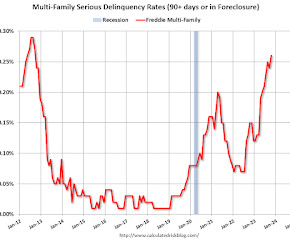
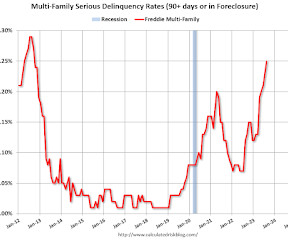
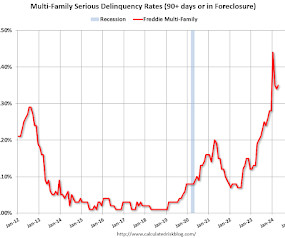
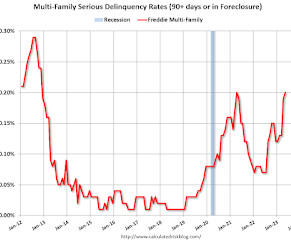
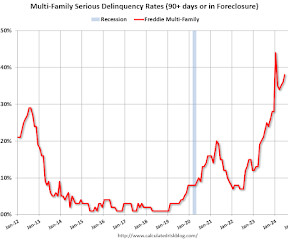
This graph shows the Freddie multi-family serious delinquency rate since 2012. Rates were still high in 2012 following the housing bust and financial crisis. Freddie Mac reports that multi-family delinquencies increased to 0.28% in November, up from 0.15% in November 2022.
This graph shows the Freddie multi-family serious delinquency rate since 2012. Rates were still high in 2012 following the housing bust and financial crisis. Freddie Mac reports that multi-family delinquencies increased to 0.26% in October, up from 0.15% in October 2022.
This graph shows the Freddie multi-family serious delinquency rate since 2012. Delinquency rates were still high in 2012 following the housing bust and financial crisis. Freddie Mac reports that multi-family delinquencies increased to 0.25% in August, up from 0.12% in August 2022.
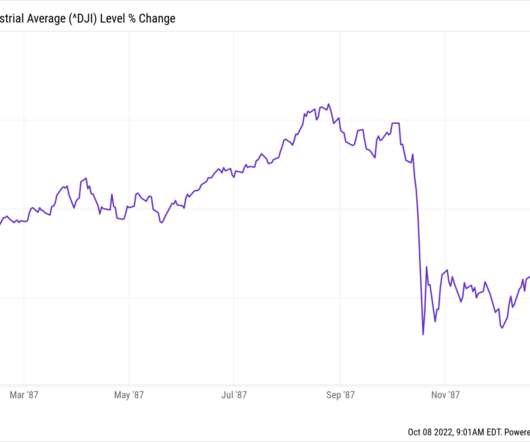
25th Anniversary Black Monday 1987 Crash (October 19, 2012). Art Cashin: Black Monday, An Unforgettable Single Day (October 19, 2012). _. Previously : Where Were You On Black Monday? October 19, 2015). It was a volatile 17-year period with numerous rallies and selloffs. Markets were flat to modestly higher over that 16-year period.
This graph shows the Freddie multi-family serious delinquency rate since 2012. Rates were still high in 2012 following the housing bust and financial crisis. Freddie Mac reports that the multi-family delinquencies rate was unchanged at 0.28% in December, and up from 0.12% in December 2022.
Today, in the Calculated Risk Real Estate Newsletter: Housing Market Index and Single Family Starts A brief excerpt: This morning, the National Association of Home Builders (NAHB) released their monthly housing market index: Builder Sentiment at Third Lowest Reading Since 2012. There are several negatives for new home builders now.
More than a decade after its 2012 launch, Citis experiment has ended with disappointed billionaires, a bitter legal battle and a lesson on the pitfalls of marketing private assets.
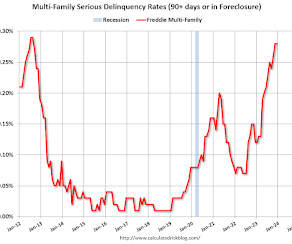
This graph shows the Freddie multi-family serious delinquency rate since 2012. Rates were still high in 2012 following the housing bust and financial crisis. Freddie Mac reports that the multi-family delinquencies rate increased to 0.35% in April, up from 0.34% in March, and down from 0.44% in January.
Several years later, in early 2012, when many people were still bearish on housing, the plunge in inventory in 2011 (blue arrow on graph below) helped me call the bottom for house prices in early 2012 (see The Housing Bottom is Here ).
Before joining General Atlantic in 2012, Martn was Co-Founder and CFO of Submarino.com, a leading Brazilian online retailer that went public on the Bovespa and was sold to Lojas Americanas in 2006. He was recently appointed to the Harvard Management Company Board.
After leaving Linscomb & Williams last year to launch an independent RIA that cuts clients in on profits, Harold Williams and his brother are being sued by the bank that bought their firm in 2012.
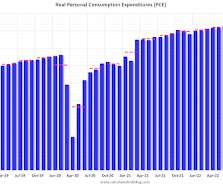
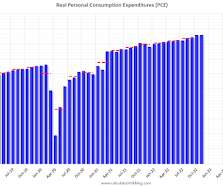
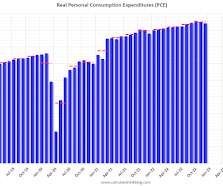
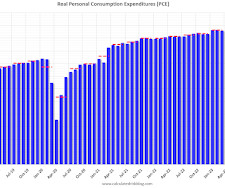
The following graph shows real Personal Consumption Expenditures (PCE) through September 2022 (2012 dollars). The PCE price index, excluding food and energy, increased 5.1 percent YoY, up from 4.9 percent in August. Note that the y-axis doesn't start at zero to better show the change. Click on graph for larger image.
in May 2025 , down from 5% price growth last May and slowest since the winter of 2012. From Cotality (formerly CoreLogic): US home price insights — July 2025 Spring homebuying season continues to be defined by slower price growth and tepid home buying activity. Year-over-year price growth dipped to 1.8% reported negative home price growth.
This graph shows the Freddie multi-family serious delinquency rate since 2012. Rates were still high in 2012 following the housing bust and financial crisis. Freddie Mac reports that the multi-family delinquencies rate declined to 0.35% in February, and down from 0.44% in January.
The following graph shows real Personal Consumption Expenditures (PCE) through July 2022 (2012 dollars). The PCE price index, excluding food and energy, increased 4.6 percent YoY, down from 4.8% Note that the y-axis doesn't start at zero to better show the change. Click on graph for larger image.
So in 2012, he left to launch SteelPeak Wealth with $250 million in AUM. After a dozen years in the wirehouse world, Reza Zamani began to recognize the limitations inherent to the model. Today, it manages $3 billioon with 20 advisors on the team.
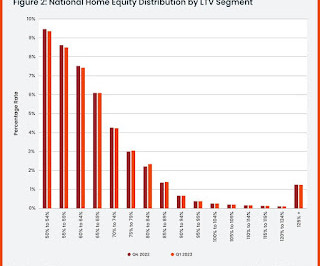
From CoreLogic: CoreLogic: US Home Borrowers See First Annual Home Equity Losses Since 2012 in Q1 2023, but Overall Mortgage Performance Remains Strong CoreLogic®. homeowners with a mortgage lost a small amount of equity year over year for the first time since early 2012, while national combined equity followed suit.
papers.ssrn.com) Economy National home builder confidence fell to one of its lowest levels since 2012. (fastcompany.com) People need to be nudged to engage in salary negotiations. calculatedriskblog.com) Tariff front running is washing out of the economic numbers. abnormalreturns.com) What you missed in our Monday linkfest.
The following graph shows real Personal Consumption Expenditures (PCE) through November 2022 (2012 dollars). The PCE price index, excluding food and energy, increased 4.7 percent YoY, down from 5.0 percent in October. Note that the y-axis doesn't start at zero to better show the change. Click on graph for larger image.
The following graph shows real Personal Consumption Expenditures (PCE) through June 2022 (2012 dollars). The PCE price index, excluding food and energy, increased 4.8 percent YoY, up from 4.7 percent in May. Note that the y-axis doesn't start at zero to better show the change. Click on graph for larger image.
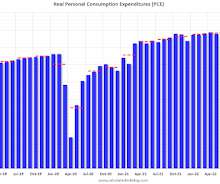
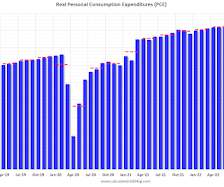
The following graph shows real Personal Consumption Expenditures (PCE) through April 2023 (2012 dollars). The PCE price index, excluding food and energy, increased 4.7 percent YoY, up from 4.6 percent in March, and down from the recent peak of 5.4 percent in February 2022. Note that the y-axis doesn't start at zero to better show the change.
Several years later, in early 2012, when many people were still bearish on housing, the plunge in inventory in 2011 (blue arrow on graph below) helped me call the bottom for house prices in early 2012 (see The Housing Bottom is Here ). Somewhat lower mortgage rates - and time - will likely lead to more new listings in 2024.
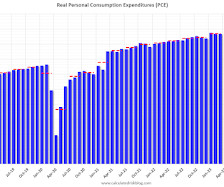
The following graph shows real Personal Consumption Expenditures (PCE) through December 2022 (2012 dollars). The PCE price index, excluding food and energy, increased 4.4 percent YoY, down from 4.7 percent in November, and down from the recent peak of 5.4 percent in February 2022. Click on graph for larger image.
In 2012, a confluence of events in Tyrone Ross Jr.’s s life, including a failed Olympic attempt, brought him to a dark place. But his experiences have built perseverance and grit that drives him forward.
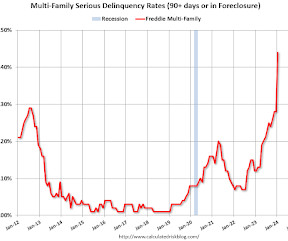
This graph shows the Freddie multi-family serious delinquency rate since 2012. Rates were still high in 2012 following the housing bust and financial crisis. Freddie Mac reports that multi-family delinquencies increased to 0.20% in May, up from 0.07% in May 2022.
They achieved the highest sales per square foot in 2012 among all retailers. ” See also : A Big Misunderstanding John Gruber, (Daring Fireball, December 20, 2012) Popular or Best? The Apple Store was clearly one of those game-changers: By 2020, Apple had opened over 500 stores in 25 countries. billion per month.
Using IRS data, University of California at Berkeley’s Emmanuel Saez and Gabriel Zucman’s 2014 study found: The share of total wealth of the top 1% has increased steadily, from below 25% in 1978 to 42% in 2012. The top 0.01% of US households had at least $111 million in net worth in 2012, compared to $4 million for the 1 %.
The following graph shows real Personal Consumption Expenditures (PCE) through August 2022 (2012 dollars). The PCE price index, excluding food and energy, increased 4.9 percent YoY, up from 4.7% Note that the y-axis doesn't start at zero to better show the change. Click on graph for larger image.
The following graph shows real Personal Consumption Expenditures (PCE) through March 2023 (2012 dollars). The PCE price index, excluding food and energy, increased 4.6 percent YoY, down from 4.7 percent in February, and down from the recent peak of 5.4 percent in February 2022. Click on graph for larger image.
Several years later, in early 2012, when many people were still bearish on housing, the plunge in inventory in 2011 (blue arrow on graph below) helped me call the bottom for house prices in early 2012 (see The Housing Bottom is Here ).
(this gives 2.8% real annual growth). Real GDP Growth Year Annual GDP Q4 / Q4 2005 3.5% 2008 0.1% -2.5% 2009 -2.6% 2020 -2.2% -1.0% 2024 1 2.8% 1 2024 estimate based on 2.8% Q4 SAAR annualized real growth rate.
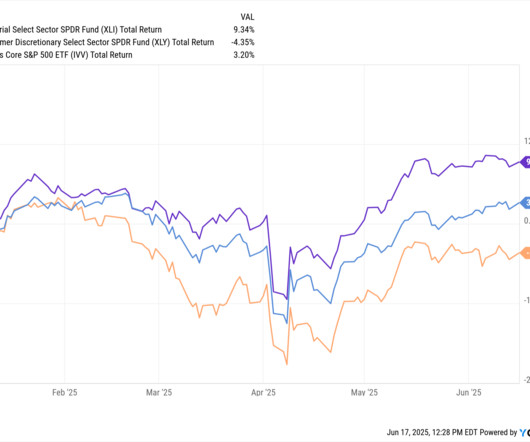
Coming into 2025 the S&P 500 had just two down years out of the past 15: 2010 +14.8% 2024 +24.9% We were all probably a little spoiled. Regardless of the reason for the recent swoon, we were due.
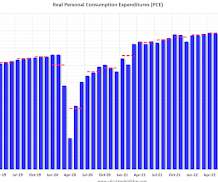
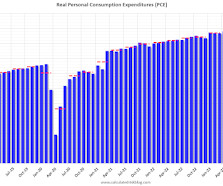
The following graph shows real Personal Consumption Expenditures (PCE) through August 2023 (2012 dollars). The PCE price index, excluding food and energy, increased 3.9 percent YoY, down from 4.3 percent in July, and down from the recent peak of 5.6 percent in February 2022. Click on graph for larger image.
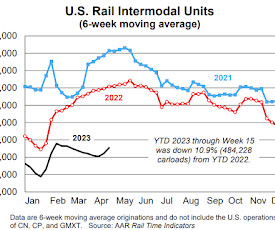
million containers and trailers, down 10.9% (484,228) from last year and the fewest for January to April since 2012. million units, down 10.9% (484,228) from last year and the fewest for January to April since 2012. April’s decline was the 14th straight and 20th in the past 21 months. In 2023 through April, volume was 3.97
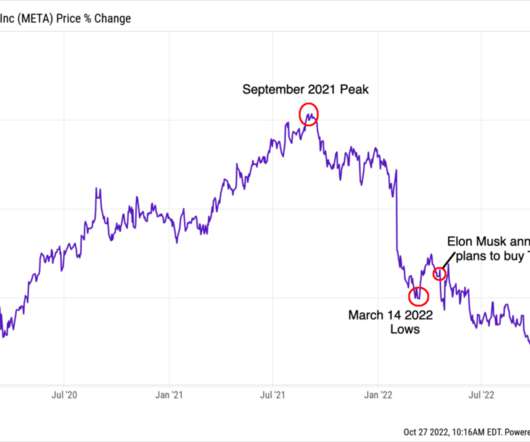
The stock is now underperforming the S&P 500 since it went public in 2012.” Previously : Less than meets the eye at Facebook (February 18, 2012). ” Regardless of what you think of Musk, he is not someone you want to be competing with if you can avoid it. MiB: Scott Galloway on The Four (October 28, 2017).
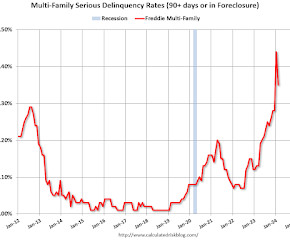
This graph shows the Freddie multi-family serious delinquency rate since 2012. Rates were still high in 2012 following the housing bust and financial crisis. Freddie Mac reports that the multi-family delinquencies rate increased to 0.36% in May, up from 0.35% in April, but down from the recent peak of 0.44% in January.
. • In fact, if you back out outliers, such as the Fed rate hikes in 2022 and the COVID shutdown in 2020, this is the first time we’ve seen home prices decline, on an adjusted basis, in any month since 2012. Condos were the first to turn, with condo prices now down nearly a full percentage point from the same time last year.
This graph shows the Freddie multi-family serious delinquency rate since 2012. Rates were still high in 2012 following the housing bust and financial crisis. Freddie Mac reports that the multi-family delinquencies rate increased to 0.38% in June, up from 0.36% in April, but down from the recent peak of 0.44% in January.
We organize all of the trending information in your field so you don't have to. Join 36,000+ users and stay up to date on the latest articles your peers are reading.
You know about us, now we want to get to know you!
Let's personalize your content
Let's get even more personalized
We recognize your account from another site in our network, please click 'Send Email' below to continue with verifying your account and setting a password.


Let's personalize your content