

BLS: Job Openings Decreased to 7.6 million in December
Calculated Risk
FEBRUARY 4, 2025
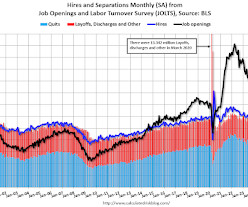
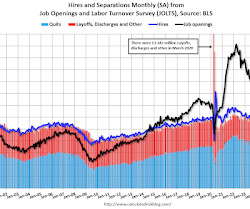
This series started in December 2000. When the blue line is above the two stacked columns, the economy is adding net jobs - when it is below the columns, the economy is losing jobs. Within separations, quits (3.2 million) and layoffs and discharges (1.8 million) changed little. This is a measure of labor market turnover.


Let's personalize your content