This site uses cookies to improve your experience. To help us insure we adhere to various privacy regulations, please select your country/region of residence. If you do not select a country, we will assume you are from the United States. Select your Cookie Settings or view our Privacy Policy and Terms of Use.
Cookie Settings
Cookies and similar technologies are used on this website for proper function of the website, for tracking performance analytics and for marketing purposes. We and some of our third-party providers may use cookie data for various purposes. Please review the cookie settings below and choose your preference.
Used for the proper function of the website
Used for monitoring website traffic and interactions
Cookie Settings
Cookies and similar technologies are used on this website for proper function of the website, for tracking performance analytics and for marketing purposes. We and some of our third-party providers may use cookie data for various purposes. Please review the cookie settings below and choose your preference.
Strictly Necessary: Used for the proper function of the website
Performance/Analytics: Used for monitoring website traffic and interactions
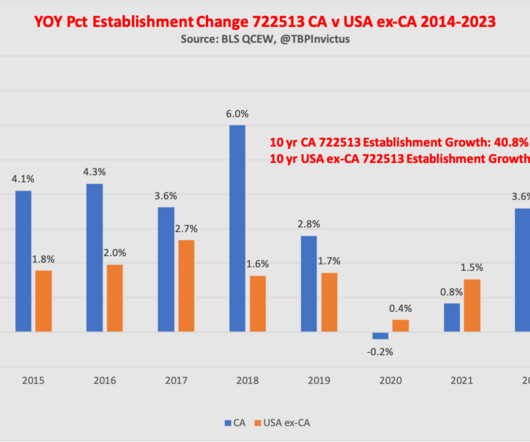
Many fast food workers (specifically) got bumped to $20/hour, from $16, in April (the law is very specific about who is eligible for the increase). Over that decade, with its minimum wage rising, California’s fast food industry has bested the rest of the US by leaps and bounds. Our story began with a Wall St.
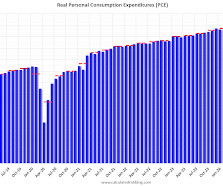
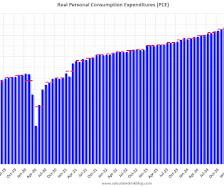
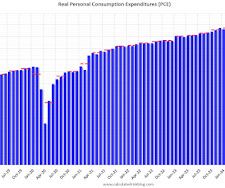
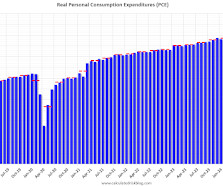
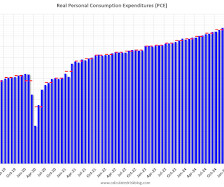
Excluding food and energy, the PCE price index increased 0.3 The PCE price index, excluding food and energy, increased 2.8 Disposable personal income (DPI), personal income less personal current taxes, increased $144.1 billion (0.7 percent) and personal consumption expenditures (PCE) increased $72.3 billion (0.4 percent in October.
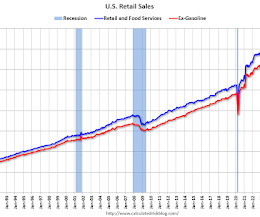
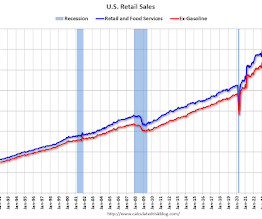
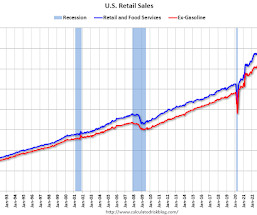
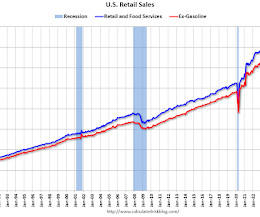
retail and food services sales for February 2025, adjusted for seasonal variation and holiday and trading-day differences, but not for price changes, were $722.7 This is monthly retail sales and food service, seasonally adjusted (total and ex-gasoline). Retail and Food service sales, ex-gasoline, increased by 3.4% billion, up 0.2
Excluding food and energy prices, the PCE price index increased 3.5 The price index for gross domestic purchases increased 3.4 percent in the first quarter, compared with an increase of 2.2 percent in the fourth quarter. The personal consumption expenditures (PCE) price index increased 3.6 percent, compared with an increase of 2.4
The food index, in contrast, rose 0.4 percent in March as the food at home index increased 0.5 percent and the food away from home index rose 0.4 The index for all items less food and energy rose 0.1 The all items less food and energy index rose 2.8 The food index increased 3.0 The index for energy fell 2.4
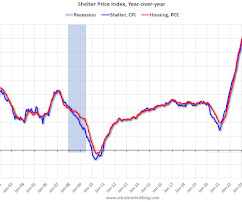
Commodities less food and energy commodities were at 0.0% The second graph shows that goods prices started to increase year-over-year (YoY) in 2020 and accelerated in 2021 due to both strong demand and supply chain disruptions. Durables were at -1.0% YoY as of March 2025, up from -1.2% YoY in February. YoY in March, unchanged from 0.0%
The index for food, in contrast, fell 0.1 percent in April as the food at home index decreased 0.4 percent and the food away from home index rose 0.4 The index for all items less food and energy rose 0.2 The all items less food and energy index rose 2.8 The food index increased 2.8 percent over the month.
retail and food services sales for January 2025, adjusted for seasonal variation and holiday and trading-day differences, but not for price changes, were $723.9 This is monthly retail sales and food service, seasonally adjusted (total and ex-gasoline). Retail and Food service sales, ex-gasoline, increased by 4.2% in January.
Excluding food and energy, the PCE price index increased less than 0.1 Excluding food and energy, the PCE price index increased 2.6 Excluding food and energy, the PCE price index increased 2.6 The PCE price index, excluding food and energy, increased 2.6 percent from one year ago. percent in June 2022.
Hey, you might have people who love food, who are good cooks. And just start eating real foods with very few ingredients. and staying away from ultra processed foods and staying away from foods that have a lot of added sugar. And just start eating real foods with very few ingredients.
The food index also increased over the month, rising 0.2 percent as the food at home index increased 0.1 percent and the food away from home index rose 0.2 The index for all items less food and energy rose 0.3 The all items less food and energy index rose 3.3 The food index increased 2.1
retail and food services sales for April 2025, adjusted for seasonal variation and holiday and trading-day differences, but not for price changes, were $724.1 This is monthly retail sales and food service, seasonally adjusted (total and ex-gasoline). Retail and Food service sales, ex-gasoline, increased by 6.2% billion, up 0.1
Excluding food and energy, the PCE price index increased 0.3 The PCE price index, excluding food and energy, increased 2.7 Disposable personal income (DPI), personal income less personal current taxes, increased $57.4 billion (0.3 percent) and personal consumption expenditures (PCE) increased $105.8 billion (0.5 Real DPI increased 0.1
Commodities less food and energy commodities were at -0.0% The second graph shows that goods prices started to increase year-over-year (YoY) in 2020 and accelerated in 2021 due to both strong demand and supply chain disruptions. Durables were at -1.2% YoY as of February 2025, unchanged from -1.2% YoY in January. YoY in January. in January.
The index for food also increased in January, rising 0.4 percent as the index for food at home rose 0.5 percent and the index for food away from home increased 0.2 The index for all items less food and energy rose 0.4 The all items less food and energy index rose 3.3 The food index increased 2.5
The index for food also increased in February, rising 0.2 percent as the index for food away from home increased 0.4 The food at home index was unchanged over the month. The index for all items less food and energy rose 0.2 The all items less food and energy index rose 3.1 The food index increased 2.6
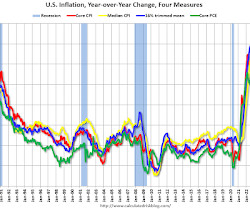
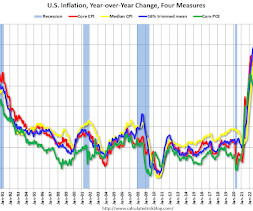
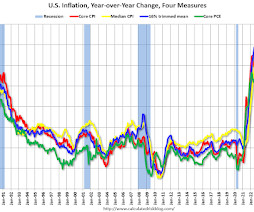
YoY in February), the trimmed-mean CPI rose 3.0% (down from 3.1%), and the CPI less food and energy rose 2.8% (down from 3.1%). This graph shows the year-over-year change for these four key measures of inflation. On a year-over-year basis, the median CPI rose 3.5% (down slightly unrounded from 3.5% Core PCE is for February was up 2.8%
YoY in November), the trimmed-mean CPI rose 3.2% (down slightly from 3.2%), and the CPI less food and energy rose 3.2% (down from 3.3%). This graph shows the year-over-year change for these four key measures of inflation. On a year-over-year basis, the median CPI rose 3.8% (down from 3.9% Core PCE is for November was up 2.8% in October.
higher food prices and 0.6% From Goldman Sachs economists: We expect a 0.34% increase in January core CPI (vs. consensus), corresponding to a year-over-year rate of 3.19% (vs. consensus). We expect a 0.36% increase in January headline CPI (vs. consensus), reflecting 0.4% higher energy prices. The y/y rates should decline a tenth to 2.8%
The PCE price index, excluding food and energy, increased 2.8 Personal saving was $843.2 billion in December and the personal saving ratepersonal saving as a percentage of disposable personal incomewas 3.8 emphasis added The December PCE price index increased 2.6 percent year-over-year (YoY), up from 2.4 percent in June 2022.
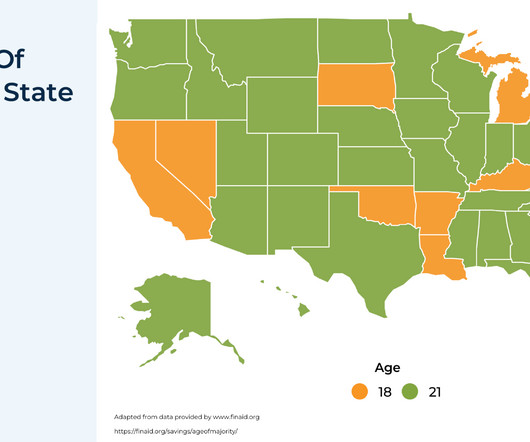
One option is to spend down UTMA assets on non-essential expenses for the child, such as summer camps or a car, while avoiding expenses like food and housing that fall under the parents' legal support obligation.
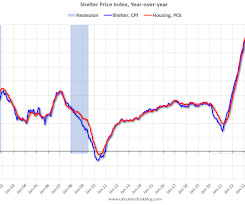
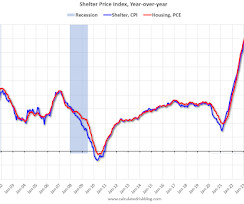
Commodities less food and energy commodities were at -0.1% Services less rent of shelter was up 3.9% YoY in January, down from 4.0% YoY in December The second graph shows that goods prices started to increase year-over-year (YoY) in 2020 and accelerated in 2021 due to both strong demand and supply chain disruptions. Durables were at -1.2%
This is monthly retail sales and food service, seasonally adjusted (total and ex-gasoline). The consensus is for a 0.2% increase in PPI, and a 0.3% increase in core PPI. 11:00 AM: NY Fed: Q4 Quarterly Report on Household Debt and Credit -- Friday, February 14th -- 8:30 AM: Retail sales for January is scheduled to be released.
Many Districts noted that higher prices for eggs and other food ingredients were impacting food processors and restaurants. Input price pressures were generally greater than sales price pressures, particularly in manufacturing and construction. Firms in multiple Districts noted difficulty passing input costs on to customers.
percent over the 12 months ending in January and that, excluding the volatile food and energy categories, core PCE prices rose 2.6 Inflation can be volatile month-to-month, and we do not overreact to one or two readings that are higher or lower than anticipated. Data released last week showed that total PCE prices rose 2.5
” A : Money is NOT a store of value to be useful, a dollar must maintain its value long enough for me to pay my rent or mortgage, buy food and energy, fund my entertainment and travel, pay my taxes, and get invested. Can you elaborate on how people misunderstand the very purpose of currency? It does that splendidly.
Commodities less food and energy commodities were at 0.6% The second graph shows that goods prices started to increase year-over-year (YoY) in 2020 and accelerated in 2021 due to both strong demand and supply chain disruptions. Durables were up 0.6% YoY as of June 2025, up from unchanged YoY in May. YoY in June, up from 0.3% YoY in May.
Commodities less food and energy commodities were at -1.2% The second graph shows that goods prices started to increase year-over-year (YoY) in 2020 and accelerated in 2021 due to both strong demand and supply chain disruptions. Durables were at -2.5% YoY as of October 2024, up from -2.9% YoY in September. YoY in September. in September.
From Goldman Sachs economists: The producer price index (PPI), the PPI excluding food and energy, and the PPI excluding food, energy, and trade were all below consensus expectations in March. The data released so far suggests the PCE inflation will be soft in March. The components relevant for core PCE were soft.
in September), the trimmed-mean CPI rose 3.2% (unchanged from 3.2%), and the CPI less food and energy rose 3.2% (unchanged from 3.2%). This graph shows the year-over-year change for these four key measures of inflation. On a year-over-year basis, the median CPI rose 4.1% (unchanged from 4.1% Core PCE is for September was up 2.7%
Excluding food and energy, the PCE price index also increased 0.1 Excluding food and energy, the PCE price index increased 2.5 Excluding food and energy, the PCE price index increased 2.5 The PCE price index, excluding food and energy, increased 2.5 Personal saving was $1.12 percent from one year ago.
When asked how much food they consumed in a meal, people of average weight assume they’ve eaten 20% less than th. One study asked people how much bread they ate after leaving an Italian restaurant. Nearly one-third of the diners couldn’t recall how much they had. And 12% of the people who ate bread denied having eaten any at all.
YoY in January), the trimmed-mean CPI rose 3.1% (unchanged from 3.1%), and the CPI less food and energy rose 3.3% (down from 3.1%). This graph shows the year-over-year change for these four key measures of inflation. On a year-over-year basis, the median CPI rose 3.5% (down from 3.6% Core PCE is for January was up 2.7% YoY, down from 2.9%
retail and food services sales for March 2025, adjusted for seasonal variation and holiday and trading-day differences, but not for price changes, were $734.9 This is monthly retail sales and food service, seasonally adjusted (total and ex-gasoline). Retail and Food service sales, ex-gasoline, increased by 5.2% billion, up 1.4
Excluding food and energy, the PCE price index increased 0.4 Excluding food and energy, the PCE price index increased 2.8 Excluding food and energy, the PCE price index increased 2.8 The PCE price index, excluding food and energy, increased 2.8 Personal saving was $1.02 percent from one year ago. percent in June 2022.
Fast food spending on the go 4. Fast food spending on the go If you’re a parent, you know the chaos of running kids from one activity to the next. I was grabbing fast food more often than I realized $10 here, $15 there. I gave myself a realistic fast food budget, so when we do eat out, its intentional. The result?
Now, I know it can drive people nuts, like it drive my mom nuts that we put our focus on core inflation and not food and energy inflation because my mom’s like, what do you mean you’re not paying attention to food and energy inflation? There’s no, nobody’s ever getting sick from the food.
consensus), reflecting higher food prices (+0.25%) and energy prices (+1.2%). From Goldman Sachs economists: We expect a 0.23% increase in June core CPI (vs. consensus), corresponding to a year-over-year rate of 2.93% (vs. consensus). We expect a 0.30% increase in headline CPI (vs. over the next few months.
This means no new clothes, gadgets, books, or takeoutonly necessities like food, rent, and hygiene products. For me, I discovered that food delivery and random Amazon purchases were my biggest spending problems. Take inventory of your spending Start by reviewing your spending habits.
This is monthly retail sales and food service, seasonally adjusted (total and ex-gasoline). The consensus is for initial claims to decrease to 225 thousand from 227 thousand last week. 8:30 AM: Retail sales for June is scheduled to be released. The consensus is for a 0.2% increase in retail sales. This graph shows retail sales since 1992.
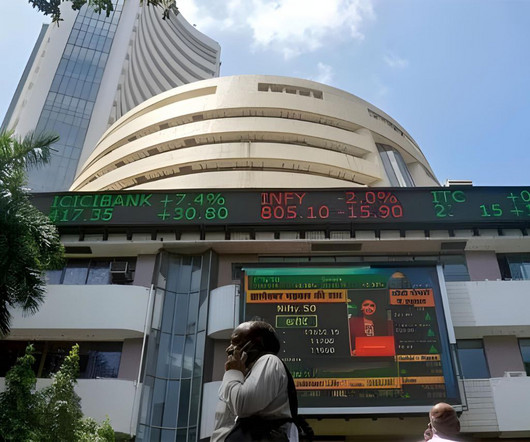
It offers products across personal care, home care, foods, and beverages, with iconic brands like Dove, Lux, and Lipton. Hindustan Unilever Limited (HUL) RSI : 27.3 – Hindustan Unilever (HUL), a subsidiary of Unilever, is India’s top FMCG company. HUL is known for its strong brand presence, innovation, and sustainable practices.
AWL Agri Business Limited was established in 1999 and is engaged in producing, refining, and marketing edible oils, food staples, specialty fats, oleochemicals, and home care products for domestic and international markets. The net profit has also grown by 21.66 percent, from Rs. 157 crore in Q4 FY24 to Rs. 191 crore in Q4 FY25. 8,328.30.
Top-Scoring Twin Momentum Stocks Here are five companies that currently score highly according to Validea’s Twin Momentum strategy: CAL-MAINE FOODS (CALM ) Score: 100% A leading producer of fresh shell eggs, CAL-MAINE FOODS excels in both fundamental and price momentum metrics.
Food for Thought… “Keep some room in your heart for the unimaginable.” – Mary Oliver Tax Tip… Did You Know That You Have the Right to Challenge the IRS? The return and principal value of investments will fluctuate as market conditions change. When sold, investments may be worth more or less than their original cost.
We organize all of the trending information in your field so you don't have to. Join 36,000+ users and stay up to date on the latest articles your peers are reading.
You know about us, now we want to get to know you!
Let's personalize your content
Let's get even more personalized
We recognize your account from another site in our network, please click 'Send Email' below to continue with verifying your account and setting a password.


Let's personalize your content