This site uses cookies to improve your experience. To help us insure we adhere to various privacy regulations, please select your country/region of residence. If you do not select a country, we will assume you are from the United States. Select your Cookie Settings or view our Privacy Policy and Terms of Use.
Cookie Settings
Cookies and similar technologies are used on this website for proper function of the website, for tracking performance analytics and for marketing purposes. We and some of our third-party providers may use cookie data for various purposes. Please review the cookie settings below and choose your preference.
Used for the proper function of the website
Used for monitoring website traffic and interactions
Cookie Settings
Cookies and similar technologies are used on this website for proper function of the website, for tracking performance analytics and for marketing purposes. We and some of our third-party providers may use cookie data for various purposes. Please review the cookie settings below and choose your preference.
Strictly Necessary: Used for the proper function of the website
Performance/Analytics: Used for monitoring website traffic and interactions
This data shows the 7-day average of daily total traveler throughput from the TSA for 2019 (Light Blue), 2020 (Black), 2021 (Blue) and 2022 (Red). The dashed line is the percent of 2019 for the seven-day average. from the same day in 2019 (90.9% Dashed purple is 2019 (STR is comparing to a strong year for hotels).
This data shows the 7-day average of daily total traveler throughput from the TSA for 2019 (Light Blue), 2020 (Black), 2021 (Blue) and 2022 (Red). The dashed line is the percent of 2019 for the seven-day average. from the same day in 2019 (88.9% Dashed purple is 2019 (STR is comparing to a strong year for hotels).
How much will the economy grow in 2025? A year ago, I argued that "the economy will avoid recession" in 2024, and that a soft landing was the likely outcome. Here are the Ten Economic Questions for 2025 and a few predictions: Question #1 for 2025: How much will the economy grow in 2025? Or will the economy lose jobs?
This data shows the 7-day average of daily total traveler throughput from the TSA for 2019 (Light Blue), 2020 (Black), 2021 (Blue) and 2022 (Red). The dashed line is the percent of 2019 for the seven-day average. from the same day in 2019 (90.9% Dashed purple is 2019 (STR is comparing to a strong year for hotels).
This data shows the 7-day average of daily total traveler throughput from the TSA for 2019 (Light Blue), 2020 (Black), 2021 (Blue) and 2022 (Red). The dashed line is the percent of 2019 for the seven-day average. from the same day in 2019 (89.0% Dashed purple is 2019 (STR is comparing to a strong year for hotels).
This data shows the 7-day average of daily total traveler throughput from the TSA for 2019 (Light Blue), 2020 (Black), 2021 (Blue) and 2022 (Red). The dashed line is the percent of 2019 for the seven-day average. from the same day in 2019 (90.9% Dashed purple is 2019 (STR is comparing to a strong year for hotels).
This data shows the 7-day average of daily total traveler throughput from the TSA for 2019 (Light Blue), 2020 (Black), 2021 (Blue) and 2022 (Red). The dashed line is the percent of 2019 for the seven-day average. below the same week in 2019 (92.2% Dashed purple is 2019 (STR is comparing to a strong year for hotels).
This data shows the 7-day average of daily total traveler throughput from the TSA for 2019 (Light Blue), 2020 (Black), 2021 (Blue) and 2022 (Red). The dashed line is the percent of 2019 for the seven-day average. from the same day in 2019 (90.9% Dashed purple is 2019 (STR is comparing to a strong year for hotels).
This data shows the 7-day average of daily total traveler throughput from the TSA for 2019 (Light Blue), 2020 (Black), 2021 (Blue) and 2022 (Red). The dashed line is the percent of 2019 for the seven-day average. from the same day in 2019 (96.1% Dashed purple is 2019 (STR is comparing to a strong year for hotels).
This data shows the 7-day average of daily total traveler throughput from the TSA for 2019 (Light Blue), 2020 (Black), 2021 (Blue) and 2022 (Red). The dashed line is the percent of 2019 for the seven-day average. The 7-day average is about at the same level as in 2019 (100.3% compared to the same week in 2019.
This data shows the 7-day average of daily total traveler throughput from the TSA for 2019 (Light Blue), 2020 (Black), 2021 (Blue) and 2022 (Red). The dashed line is the percent of 2019 for the seven-day average. from the same day in 2019 (90.9% Dashed purple is 2019 (STR is comparing to a strong year for hotels).
economy is very resilient and was on solid footing at the beginning of the year, the administration might reverse many of the tariffs (we've seen that before), and Congress might take back complete authority for tariffs. Also, perhaps these tariffs are not enough to topple the economy. Trade should not be a weapon.
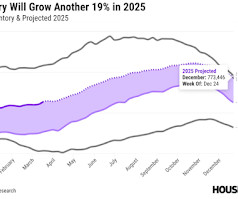
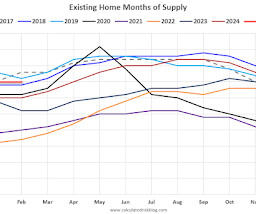
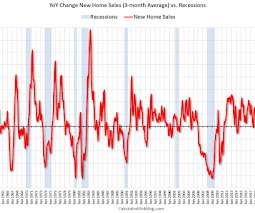
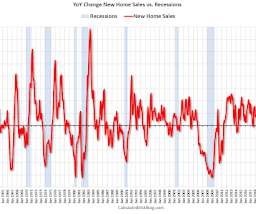
Altos Research put out an updated inventory projection last week showing that inventory might end the year at 2019 levels! If inventory is close to 2019 levels by the end of 2025, and sales remain sluggish, months-of-supply will move up sharply.
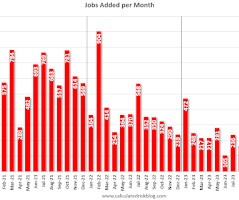
2) Employment: Through November 2023, the economy added 2.6 Or will the economy lose jobs? The bad news - for job growth - is that a combination of a slowing economy, demographics and a labor market near full employment suggests fewer jobs will be added in 2024. Or will the economy lose jobs? million jobs in 2023.
This data shows the 7-day average of daily total traveler throughput from the TSA for 2019 (Light Blue), 2020 (Black), 2021 (Blue) and 2022 (Red). The dashed line is the percent of 2019 for the seven-day average. below the same week in 2019 (94.5% Dashed purple is 2019 (STR is comparing to a strong year for hotels).
This data shows the 7-day average of daily total traveler throughput from the TSA for 2019 (Light Blue), 2020 (Black), 2021 (Blue) and 2022 (Red). The dashed line is the percent of 2019 for the seven-day average. from the same day in 2019 (90.9% Dashed purple is 2019 (STR is comparing to a strong year for hotels).
This data shows the 7-day average of daily total traveler throughput from the TSA for 2019 (Light Blue), 2020 (Black), 2021 (Blue) and 2022 (Red). The dashed line is the percent of 2019 for the seven-day average. below the same week in 2019 (89.9% Dashed purple is 2019 (STR is comparing to a strong year for hotels).
This data shows the 7-day average of daily total traveler throughput from the TSA for 2019 (Light Blue), 2020 (Black), 2021 (Blue) and 2022 (Red). The dashed line is the percent of 2019 for the seven-day average. below the same week in 2019 (93.1% Dashed purple is 2019 (STR is comparing to a strong year for hotels).
This data shows the 7-day average of daily total traveler throughput from the TSA for 2019 (Light Blue), 2020 (Black), 2021 (Blue) and 2022 (Red). The dashed line is the percent of 2019 for the seven-day average. from the same day in 2019 (93.1% Dashed purple is 2019 (STR is comparing to a strong year for hotels).
This data shows the 7-day average of daily total traveler throughput from the TSA for 2019 (Light Blue), 2020 (Black), 2021 (Blue) and 2022 (Red). The dashed line is the percent of 2019 for the seven-day average. from the same day in 2019 (90.1% Dashed purple is 2019 (STR is comparing to a strong year for hotels).
This data shows the 7-day average of daily total traveler throughput from the TSA for 2019 (Light Blue), 2020 (Black), 2021 (Blue) and 2022 (Red). The dashed line is the percent of 2019 for the seven-day average. from the same day in 2019 (87.9% Dashed purple is 2019 (STR is comparing to a strong year for hotels).
This data shows the 7-day average of daily total traveler throughput from the TSA for 2019 (Light Blue), 2020 (Black), 2021 (Blue) and 2022 (Red). The dashed line is the percent of 2019 for the seven-day average. below the same week in 2019 (92.8% Dashed purple is 2019 (STR is comparing to a strong year for hotels).
economy is very resilient and was on solid footing at the beginning of the year, the administration might reverse many of the tariffs (we've seen that before), and Congress might take back complete authority for tariffs. Also, perhaps these tariffs are not enough to topple the economy.
This data shows the 7-day average of daily total traveler throughput from the TSA for 2019 (Light Blue), 2020 (Black), 2021 (Blue) and 2022 (Red). The dashed line is the percent of 2019 for the seven-day average. below the same week in 2019 (91.9% Dashed purple is 2019 (STR is comparing to a strong year for hotels).
economy is very resilient and was on solid footing at the beginning of the year, the administration might reverse many of the tariffs (we've seen that before), and Congress might place some checks on the executive branch. Also, perhaps the tariffs are not enough to topple the economy. Trade should not be a weapon.”
This data shows the 7-day average of daily total traveler throughput from the TSA for 2019 (Light Blue), 2020 (Black), 2021 (Blue) and 2022 (Red). The dashed line is the percent of 2019 for the seven-day average. below the same week in 2019 (94.7% Dashed purple is 2019 (STR is comparing to a strong year for hotels).
At this moment, we cant talk housing without mentioning the overall economy. economy is very resilient, was on solid footing at the beginning of the year, and the tariffs might be lowered or reversed). months in February 2019. Since then, policy and the outlook have taken a turn for the worse. Months-of-supply was at 3.5
This data shows the 7-day average of daily total traveler throughput from the TSA for 2019 (Light Blue), 2020 (Black), 2021 (Blue) and 2022 (Red). The dashed line is the percent of 2019 for the seven-day average. below the same week in 2019 (97.4% Dashed purple is 2019 (STR is comparing to a strong year for hotels).
1) Economic growth: Economic growth was probably close to 1% in 2022 as the economy slowed following the economic rebound in 2021. How much will the economy grow in 2023? Defaulting on the debt with an already weak economy will likely push the economy into recession. Or will the economy lose jobs? 2008 0.1% -2.5%
We discuss US fiscal policy, recession risks, and her New York Times bestseller “ The Deficit Myth: Modern Monetary Theory and the Birth of the Peoples Economy.” She was also named to Barron’s 100 Most Influential Women in Finance.
This data shows the 7-day average of daily total traveler throughput from the TSA for 2019 (Light Blue), 2020 (Black), 2021 (Blue) and 2022 (Red). The dashed line is the percent of 2019 for the seven-day average. from the same day in 2019 (89.1% Dashed purple is 2019 (STR is comparing to a strong year for hotels).
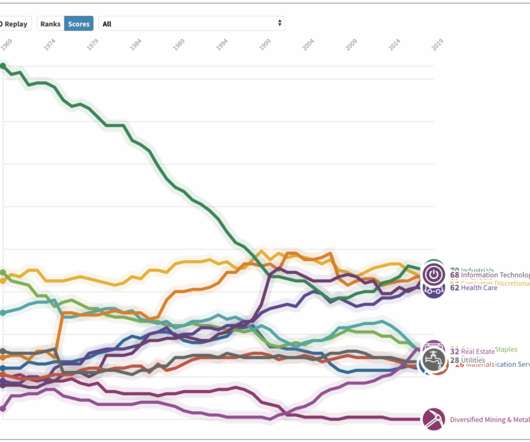
Here is QAD from 2019: In business, change is inevitable , and those that fail to adapt and innovate are often doomed to failure. The S&P acts as a snapshot that illuminates which companies and industries are the largest in the economy at any given time.
We did see negative real GDP growth in Q1 and in Q2 - but that didn't mean the US economy was in a recession (and this has never been the definition of a US recession). And other measures of the economy were also positive, especially employment. This is now happening , but this usually leads the economy by a year or more.
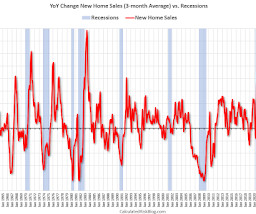
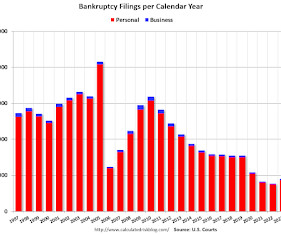
Bankruptcies fell especially sharply after the pandemic began in early 2020, despite some COVID-related disruptions to the economy. 2023 was the 3rd lowest year for bankruptcy filings, and 42% below the pre-pandemic level in 2019. Click on graph for larger image.
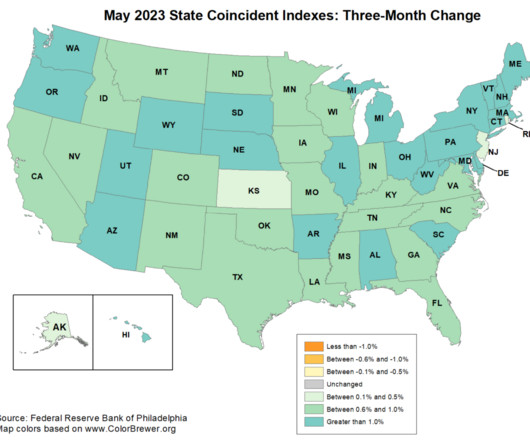
Rising rates, falling savings, increased deficits, dubious GDP : Ever since the yield curve inverted and warnings of “imminent recession” filled the air, the Philly Fed’s map of State Coincident Indexes has provided a good real-time snapshot of the state of the economy. Previously : Are We in a Recession? (No)
How much will the economy grow in 2024? A year ago, I argued that "the economy will avoid recession" in 2023, even though some key indicators suggested a possible recession, the FOMC was forecasting an employment recession, and many Wall Street analysts were forecasting an economic recession. Or will the economy lose jobs?
Most observers of the economy assumed the answer to his question was “some amount,” but I believe di Giovanni and his co-authors are the first to quantify it: “Our analysis of the relative importance of supply-side versus demand-side factors finds 60 percent of U.S. Jerome Powell and the FOMC should ask themselves three questions: 1.
However, they are significant — and rising rates this year have been a headwind for both equities and the economy. Alas, today’s inflation is 1) not like that of the 1970s; 2) the economy is nothing like the 1980s double-dip recession; and 3) Jerome Powell is no Paul Volcker. 1 and 2 are good, I suspect 3 is problematic.
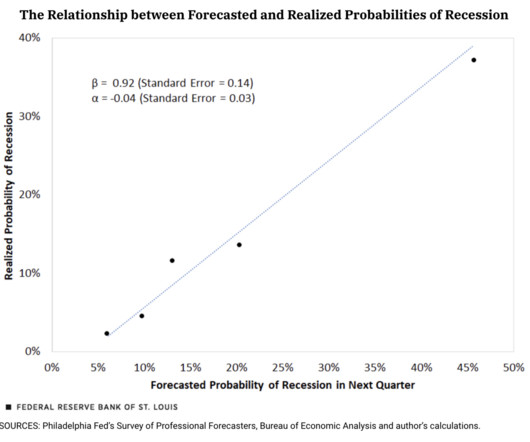
economy in the next quarter, according to the Survey of Professional Forecasters (SPF) conducted by the Federal Reserve Bank of Philadelphia. Kidding aside, Tim Harford reminds us that “In 2008, the consensus from forecasters was that not a single economy would fall into recession in 2009.” ” Why? .”
price growth that characterized the pre-pandemic business cycle of 2007–2019. Labor and Capital have swapped roles in 2020-era inflation: Over the 4 decades preceding the pandemic (1979 to 2019), profits contributed 11% to price growth while labor costs added more than half – about 60%. a pronounced acceleration over the 1.8%
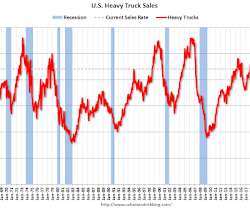
Sales in 2022 were impacted significantly by supply chain disruptions, and sales were still down 19% from the 2019 level. This suggests vehicle sales might increase in 2023 even with higher rates and a soft economy. Then heavy truck sales increased to a new all-time high of 570 thousand SAAR in April 2019. million, down 8.1%
Two examples: not reaching a fiscal agreement and going off the "fiscal cliff" probably would have led to a recession, and Congress refusing to "pay the bills" would have been a policy error that would have taken the economy into recession. This has happened , but this usually leads the economy by a year or more.
Consider these columns going back to 2013 pointing out the foolishness of tax-payer subsidized corporate welfare queens (2013), and why median wages were rising ( 2016 , 2017 , 2018 , 2018 , 2019 ). This attests to the robustness of the labor economy, recession or not. Then came the pandemic, and a huge federal worker subsidy.
Good news can be bad news in the short run, but a solid economy usually becomes good news again once we get past the initial market reaction. If the underlying economy is sound, pullbacks like this can actually be a positive for the longer-term health of the market. The economy created over 2 million jobs in 2024, down from 2.4
We organize all of the trending information in your field so you don't have to. Join 36,000+ users and stay up to date on the latest articles your peers are reading.
You know about us, now we want to get to know you!
Let's personalize your content
Let's get even more personalized
We recognize your account from another site in our network, please click 'Send Email' below to continue with verifying your account and setting a password.


Let's personalize your content