This site uses cookies to improve your experience. To help us insure we adhere to various privacy regulations, please select your country/region of residence. If you do not select a country, we will assume you are from the United States. Select your Cookie Settings or view our Privacy Policy and Terms of Use.
Cookie Settings
Cookies and similar technologies are used on this website for proper function of the website, for tracking performance analytics and for marketing purposes. We and some of our third-party providers may use cookie data for various purposes. Please review the cookie settings below and choose your preference.
Used for the proper function of the website
Used for monitoring website traffic and interactions
Cookie Settings
Cookies and similar technologies are used on this website for proper function of the website, for tracking performance analytics and for marketing purposes. We and some of our third-party providers may use cookie data for various purposes. Please review the cookie settings below and choose your preference.
Strictly Necessary: Used for the proper function of the website
Performance/Analytics: Used for monitoring website traffic and interactions
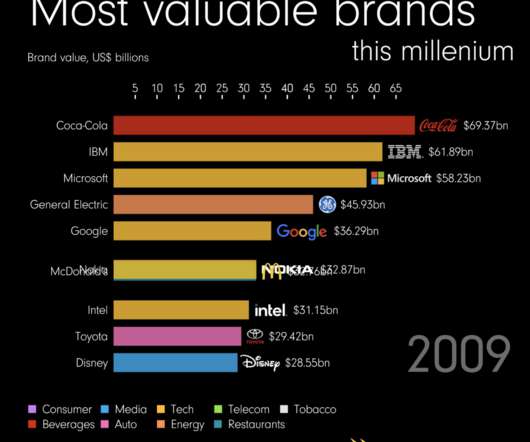
The post Most Valuable Brands, 2000–2022 appeared first on The Big Picture. For some companies, a brand is something that helps slightly boost customer engagement and sales. But for others, including some of the largest companies in the world, a strong brand is one of their most valuable assets.
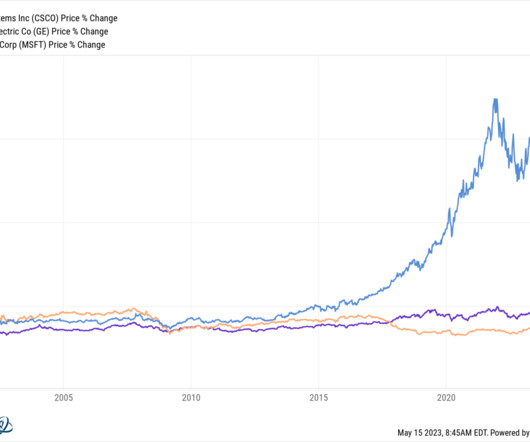
By the time this cover story was published on May 15, 2000, the price of $CSCO was making all-time-highs, and it was predicted the company would become the first trillion-dollar market-cap firm in history. On March 27th, 2000, a mere 2 weeks after this cover story, the stock peaked. Alas, it was not meant to be.
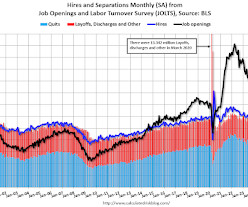
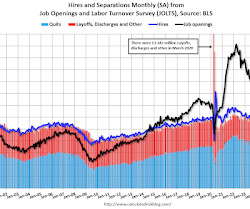
This series started in December 2000. Within separations, quits (3.2 million) and layoffs and discharges (1.8 million) changed little. emphasis added The following graph shows job openings (black line), hires (dark blue), Layoff, Discharges and other (red column), and Quits (light blue column) from the JOLTS.
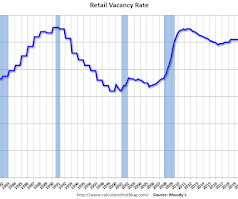
This graph shows the strip mall vacancy rate starting in 1980 (prior to 2000 the data is annual). Moody's reports the strip mall vacancy rates was 10.3% in Q4, down slightly from 10.4% in Q4 2023. Back in the '80s, there was overbuilding in the mall sector even as the vacancy rate was rising.
This series started in December 2000. Within separations, quits (3.2 million) and layoffs and discharges (1.8 million) changed little. emphasis added The following graph shows job openings (black line), hires (dark blue), Layoff, Discharges and other (red column), and Quits (light blue column) from the JOLTS.
This series started in December 2000. Within separations, quits (3.2 million) and layoffs and discharges (1.8 million) changed little. emphasis added The following graph shows job openings (black line), hires (dark blue), Layoff, Discharges and other (red column), and Quits (light blue column) from the JOLTS.
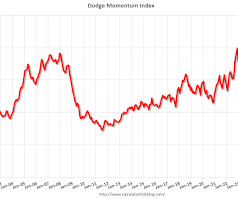
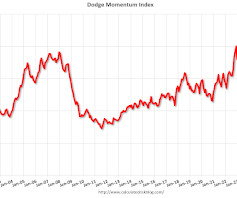
2000=100) from the revised February reading of 220.9. From Dodge Data Analytics: Dodge Momentum Index Declines 7% in March The Dodge Momentum Index (DMI) , issued by Dodge Construction Network, receded 6.9% in March to 205.6 Over the month, commercial planning declined 7.8% while institutional planning fell 5.0%.
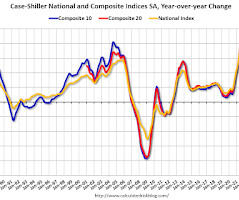
This graph shows graph shows the Year over year change in the seasonally adjusted National Index, Composite 10 and Composite 20 indexes through the most recent report (the Composite 20 was started in January 2000). The consensus is for an 4.1% 8:30 AM: The initial weekly unemployment claims report will be released.
This series started in December 2000. Within separations, quits (3.3 million) were unchanged and layoffs and discharges (1.6 million) edged down. emphasis added The following graph shows job openings (black line), hires (dark blue), Layoff, Discharges and other (red column), and Quits (light blue column) from the JOLTS.
ofdollarsanddata.com) The Russell 2000 is not a great index. (mrzepczynski.blogspot.com) Hedge fund fees have historically taken up nearly 50% of gains. institutionalinvestor.com) Research How do the three big arguments against passive investing hold up? scheplick.com) Quality value stocks perform well in the wake of an inflation shock.
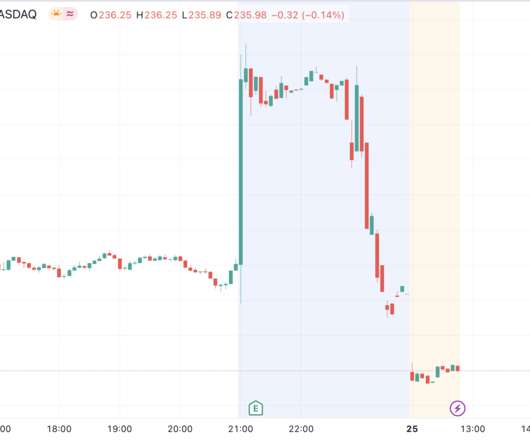
I had a bit of a flashback last night to the year 2000, sitting in my office after hours watching JDS Uniphase collapse on the heels of its conference call after reporting “better than expected” earnings for the quarter.
From March 2000 to the double lows October 2002 and March 2003, the Nasdaq 100 fell 82.9% (peak to trough). For two decades, every dip purchase was soon rewarded. It takes a while to change behavior. Look at the dotcom implosion (and the September 11 terrorist attacks).
Headline Jobs, Top 10 Streaks Year Ended Streak, Months 1 2020 113 2 Current, N/A 54 1 3 1990 48 4 2007 46 5 1979 45 6 tie 1943 33 6 tie 1986 33 6 tie 2000 33 9 1967 29 10 1995 25 1 Currrent Streak Summary: The headline jobs number in the May employment report was above expectations and April and May payrolls were revised up by 16,000 combined.
TAG Intel is led by Jack Devine, a 32-year veteran of the CIA, who aims to democratize the information he’s been bringing to global corporate clients since 2000.
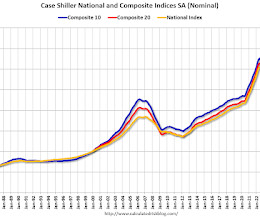
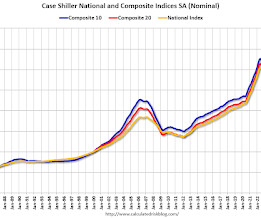
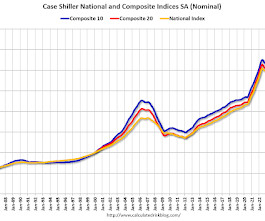
The first graph shows the nominal seasonally adjusted Composite 10, Composite 20 and National indices (the Composite 20 was started in January 2000). With New York leading the nation for the seventh consecutive month and U.S. banks reporting strong Q4 earnings, this could set the Big Apple up as we close out the year. in November (SA).
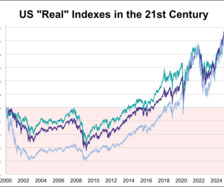
Here is a look at real (inflation-adjusted) charts of the S&P 500, Dow 30, and Nasdaq composite since their 2000 highs. We've updated this through the April 2025 close.
Here is a look at real (inflation-adjusted) charts of the S&P 500, Dow 30, and Nasdaq composite since their 2000 highs. We've updated this through the June 2025 close.
2000=100) from the revised November reading of 192.3. From Dodge Data Analytics: Dodge Momentum Index Grows 10% in December The Dodge Momentum Index (DMI), issued by Dodge Construction Network, grew 10.2% in December to 212.0 Over the month, commercial planning increased 14.2% while institutional planning improved 2.5%.
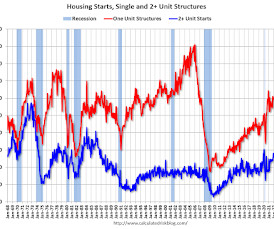
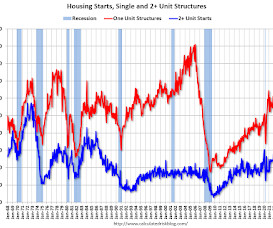
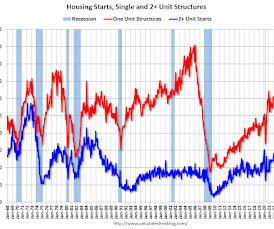
The first graph shows single and multi-family housing starts since 2000. Authorizations of units in buildings with five units or more were at a rate of 404,000 in February. emphasis added Click on graph for larger image. Multi-family starts (blue, 2+ units) increased month-over-month in February. Multi-family starts were down 4.6%
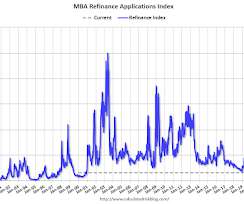
Mortgage application activity was lower last week, with overall applications declining over two percent to their lowest level since 2000. The refinance index, however, fell five percent to its lowest level since November 2000 , driven by a six percent drop in conventional refinance applications.”
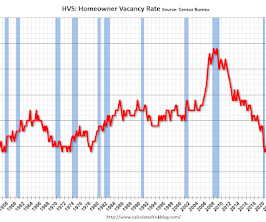
The Red dots are the decennial Census homeownership rates for April 1st, 1990, 2000, 2010, and 2020. The homeownership rate of 65.1 percent was not statistically different from the rate in the first quarter 2024 (65.6 percent) and lower than the rate in the fourth quarter 2024 (65.7 emphasis added Click on graph for larger image.
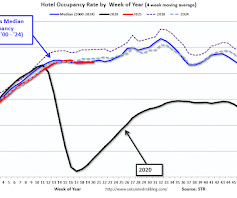
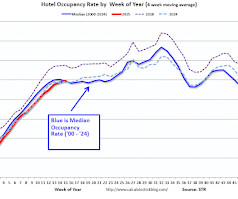
The 4-week average of the occupancy rate is tracking below both last year and the median rate for the period 2000 through 2024 (Blue). The red line is for 2025, blue is the median, and dashed light blue is for 2024. Dashed purple is for 2018, the record year for hotel occupancy.
This series started in December 2000. Within separations, quits (3.3 million) and layoffs and discharges (1.6 million) changed little. emphasis added The following graph shows job openings (black line), hires (dark blue), Layoff, Discharges and other (red column), and Quits (light blue column) from the JOLTS.
Here is a look at real (inflation-adjusted) charts of the S&P 500, Dow 30, and Nasdaq composite since their 2000 highs. We've updated this through the May 2025 close.
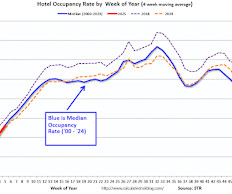
The 4-week average of the occupancy rate is tracking last year and is at the median rate for the period 2000 through 2024 (Blue). The red line is for 2025, blue is the median, and dashed light blue is for 2024. Dashed purple is for 2018, the record year for hotel occupancy.
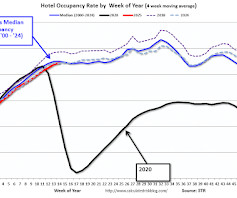
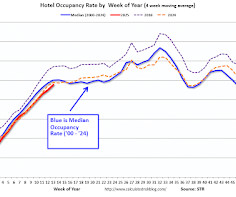
The 4-week average of the occupancy rate is tracking last year and is lower than the median rate for the period 2000 through 2024 (Blue). Dashed purple is for 2018, the record year for hotel occupancy. Note: Y-axis doesn't start at zero to better show the seasonal change.
The 4-week average of the occupancy rate is tracking below last year and is lower than the median rate for the period 2000 through 2024 (Blue). Dashed purple is for 2018, the record year for hotel occupancy. Note: Y-axis doesn't start at zero to better show the seasonal change.
The 4-week average of the occupancy rate is tracking both last year and the median rate for the period 2000 through 2024 (Blue). The red line is for 2025, blue is the median, and dashed light blue is for 2024. Dashed purple is for 2018, the record year for hotel occupancy. Note: Y-axis doesn't start at zero to better show the seasonal change.
The 4-week average of the occupancy rate is tracking last year and is lower than the median rate for the period 2000 through 2024 (Blue). Dashed purple is for 2018, the record year for hotel occupancy. Note: Y-axis doesn't start at zero to better show the seasonal change.
TAG Intel is led by Jack Devine, a 32-year veteran of the CIA, who aims to democratize the information he’s been bringing to global corporate clients since 2000.
The first graph shows the nominal seasonally adjusted Composite 10, Composite 20 and National indices (the Composite 20 was started in January 2000). Limited supply and steady demand drove prices higher across most metropolitan areas, despite affordability challenges remaining firmly in place." emphasis added Click on graph for larger image.
The first graph shows single and multi-family housing starts since 2000. Authorizations of units in buildings with five units or more were at a rate of 427,000 in January. emphasis added Click on graph for larger image. Multi-family starts (blue, 2+ units) decreased month-over-month in January. Multi-family starts were up 2.2% year-over-year.
Job Streak Through March 2025, the employment report indicated positive job growth for 51 consecutive months, putting the current streak in 2nd place of the longest job streaks in US history (since 1939).
The first graph shows single and multi-family housing starts since 2000. Authorizations of units in buildings with five units or more were at a rate of 445,000 in March. emphasis added Click on graph for larger image. Multi-family starts (blue, 2+ units) decreased month-over-month in March. year-over-year.
The following graph shows the year-over-year change through September 2024, in the seasonally adjusted Case-Shiller Composite 10, Composite 20 and National indices (the Composite 20 was started in January 2000). The Case-Shiller Home Price Indices for "September" is a 3-month average of July, August and September closing prices.
The first graph shows the nominal seasonally adjusted Composite 10, Composite 20 and National indices (the Composite 20 was started in January 2000). With stronger gains in the Northeast and West than the South, blue states have outperformed red states dating back to July 2023.” emphasis added Click on graph for larger image. in August (SA).
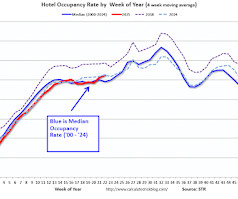
The 4-week average of the occupancy rate is tracking last year and above the median rate for the period 2000 through 2024 (Blue). The red line is for 2025, blue is the median, and dashed light blue is for 2024. Dashed purple is for 2018, the record year for hotel occupancy.
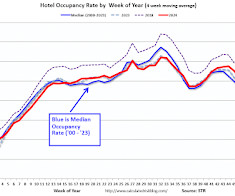
The 4-week average of the occupancy rate is above both last year and the median rate for the period 2000 through 2023 (Blue) - and will likely finish mostly unchanged year-over-year. The red line is for 2024, blue is the median, and dashed light blue is for 2023. Dashed purple is for 2018, the record year for hotel occupancy.
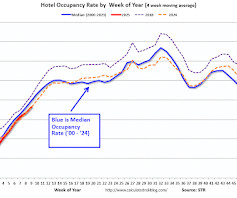
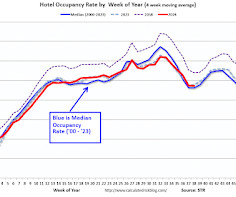
The 4-week average of the occupancy rate is tracking last year and is close to the median rate for the period 2000 through 2023 (Blue). Dashed purple is for 2018, the record year for hotel occupancy. Note: Y-axis doesn't start at zero to better show the seasonal change.
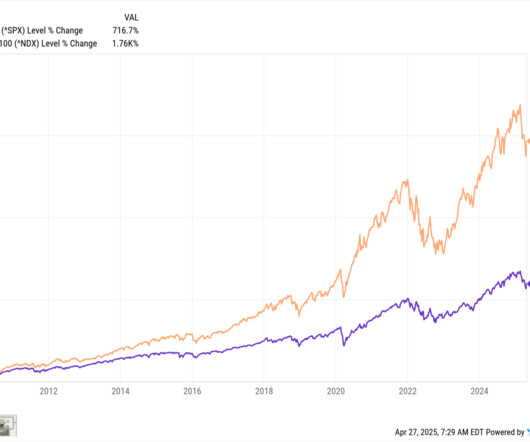
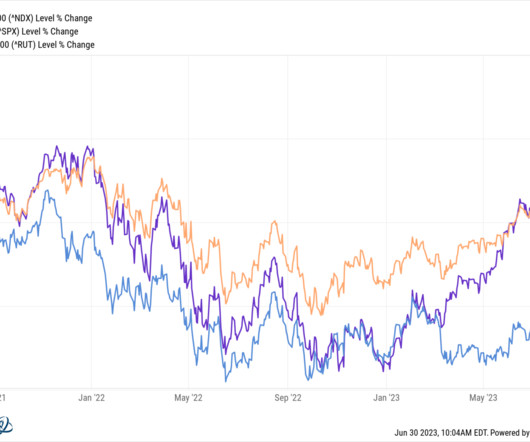
1 As of this moment, the indices stand appreciably higher than where they were on January 1, 2023: The NASDAQ 100 is up >38%, the S&P 500 is up ~15.5%, and the Russell 2000 small cap index is up almost 7%. Because almost nobody saw this rally coming. These numbers would make for a respectable year much less half that time.
The first graph shows the nominal seasonally adjusted Composite 10, Composite 20 and National indices (the Composite 20 was started in January 2000). Rather than broad declines, we are seeing a slower, more sustainable pace of price growth. emphasis added Click on graph for larger image. The Composite 10 index was up 0.5% in February (SA).
We organize all of the trending information in your field so you don't have to. Join 36,000+ users and stay up to date on the latest articles your peers are reading.
You know about us, now we want to get to know you!
Let's personalize your content
Let's get even more personalized
We recognize your account from another site in our network, please click 'Send Email' below to continue with verifying your account and setting a password.


Let's personalize your content