This site uses cookies to improve your experience. To help us insure we adhere to various privacy regulations, please select your country/region of residence. If you do not select a country, we will assume you are from the United States. Select your Cookie Settings or view our Privacy Policy and Terms of Use.
Cookie Settings
Cookies and similar technologies are used on this website for proper function of the website, for tracking performance analytics and for marketing purposes. We and some of our third-party providers may use cookie data for various purposes. Please review the cookie settings below and choose your preference.
Used for the proper function of the website
Used for monitoring website traffic and interactions
Cookie Settings
Cookies and similar technologies are used on this website for proper function of the website, for tracking performance analytics and for marketing purposes. We and some of our third-party providers may use cookie data for various purposes. Please review the cookie settings below and choose your preference.
Strictly Necessary: Used for the proper function of the website
Performance/Analytics: Used for monitoring website traffic and interactions
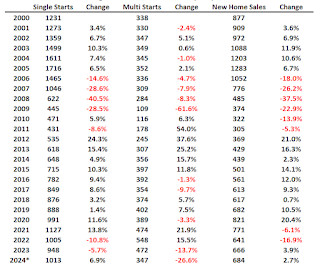
Here is a review of the Ten Economic Questions for 2024. 1) Economic growth: Economic growth was probably close to 2.8% New home sales were up 2.1% Note: RI is mostly investment in new single-family structures, multifamily structures, home improvement and commissions on existing home sales. in 2024 (around 2.6%
Fed's Beige Book Economic activity rose slightly in most Districts. Though growth in economic activity was generally small, expectations for growth rose moderately across most geographies and sectors. Three regions exhibited modest or moderate growth that offset flat or slightly declining activity in two others.
Fed's Beige Book Economic activity increased slightly from late May through early July. Auto sales receded modestly on average, after consumers had rushed to buy vehicles earlier this year to avoid tariffs. Home sales were flat or little changed in most Districts , and nonresidential real estate activity was also mostly steady.
Fed's Beige Book Economic activity was little changed since the previous report, but uncertainty around international trade policy was pervasive across reports. Home sales rose somewhat, and many Districts continued to note low inventory levels. In addition, there were scattered reports of firms preparing for layoffs.
Today, in the Calculated Risk Real Estate Newsletter: California Home Sales Up 4.9% Elevated interest rates and economic uncertainty ease March home sales, C.A.R. reports Marchs sales pace fell 2.3 Elevated interest rates and economic uncertainty ease March home sales, C.A.R.
Fed's Beige Book Economic activity increased slightly to moderately across the twelve Federal Reserve Districts in late November and December. Consumer spending moved up moderately, with most Districts reporting strong holiday sales that exceeded expectations. Vehicle sales grew modestly. Commercial real estate sales edged up.
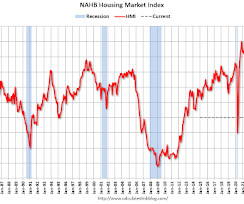
Also at 8:30 AM, Retail sales for June is scheduled to be released. increase in retail sales. Any number below 50 indicates that more builders view sales conditions as poor than good. • Economic Outlook , At the Housing Partnership Network Symposium, Washington, D.C. The consensus is for a 0.2% up from -4.0. •
Fed's Beige Book Overall economic activity rose slightly since mid-January. Vehicle sales were modestly lower on balance. Overall expectations for economic activity over the coming months were slightly optimistic. Six Districts reported no change, four reported modest or moderate growth, and two noted slight contractions.
At 8:30 AM, Retail sales for March is scheduled to be released. increase in retail sales. Any number below 50 indicates that more builders view sales conditions as poor than good. At 1:30 PM, Speech, Fed Chair Jerome Powell, Economic Outlook, At the Economic Club of Chicago, Chicago, Ill.
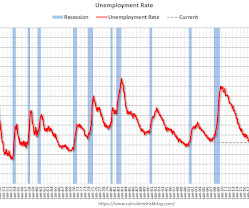
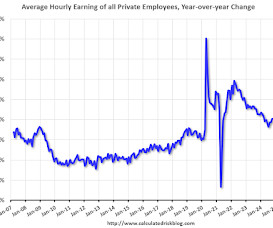
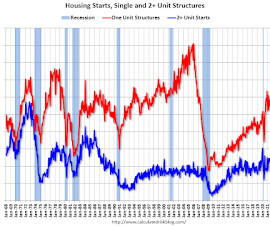
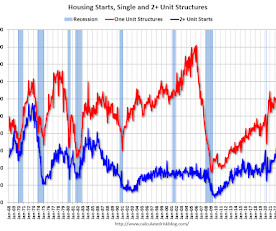
Early in February , I expressed my "increasing concern" about the negative economic impact of "executive / fiscal policy errors", however, I concluded that post by noting that I was not currently on recession watch. Here is an update to a graph that uses new home sales, single family housing starts and residential investment. (I
Earlier I posted some questions on my blog for next year: Ten Economic Questions for 2025. Some of these questions concern real estate (inventory, house prices, housing starts, new home sales), and I posted thoughts on those in the newsletter (others like GDP and employment will be on this blog). in November, up from 3.7%
Early in February , I expressed my "increasing concern" about the negative economic impact of "executive / fiscal policy errors", however, I concluded that post by noting that I was not currently on recession watch. This graph uses new home sales, single family housing starts and residential investment. (I
Bureau of Economic Analysis. Real final sales to private domestic purchasers, the sum of consumer spending and gross private fixed investment, increased 3.0 From the BEA: Gross Domestic Product, 1st Quarter 2025 (Advance Estimate) Real gross domestic product (GDP) decreased at an annual rate of 0.3 percent in the fourth quarter.
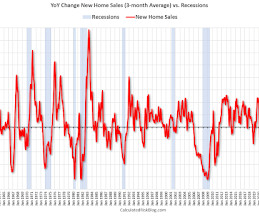
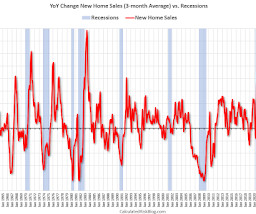
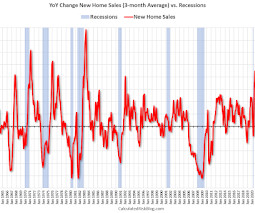
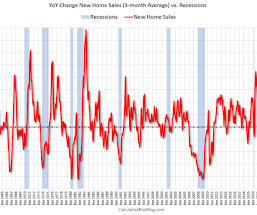
Early in February , I expressed my "increasing concern" about the negative economic impact of "executive / fiscal policy errors", however, I concluded that post by noting that I was not currently on recession watch. This graph shows the YoY change in New Home Sales from the Census Bureau. And light vehicle sales were strong in April.
At 10:00 AM, New Home Sales for March from the Census Bureau. At 2:00 PM, the Federal Reserve Beige Book , an informal review by the Federal Reserve Banks of current economic conditions in their Districts. The consensus is for 680 thousand SAAR, up from 676 thousand in February.
The challenge is how to frame the current economic scenario in a way that is useful and informative and not the usual run-of-the-mill noise. 2) What will their impact be on economic activity and inflation? I didnt understand this as representing a significant threat to the established economic order. In a word, the U.S.
From Goldman: Following [Wednesday]’s data, we have left our Q4 GDP tracking estimate unchanged at +2.4% (quarter-over-quarter annualized) and our Q4 domestic final sales forecast unchanged at +2.0%. percent on November 27, up from 2.6 percent on November 19. [Nov percent on November 27, up from 2.6 percent on November 19. percent to 3.0
How about housing starts and new home sales in 2025? Excerpt: Earlier I posted some questions on my blog for next year: Ten Economic Questions for 2025. Here is a review of the Ten Economic Questions for 2024. New home sales were up 2.1% How about housing starts and new home sales in 2025?
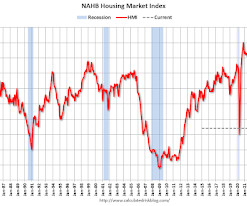
Any number below 50 indicates that more builders view sales conditions as poor than good. The recent dip in mortgage rates may have pushed some buyers off the fence in March, helping builders with sales activity, said NAHB Chairman Buddy Hughes, a home builder and developer from Lexington, N.C.
Earlier I posted some questions on my blog for next year: Ten Economic Questions for 2025. Some of these questions concern real estate (inventory, house prices, housing starts, new home sales), and I posted thoughts on those in the newsletter (others like GDP and employment will be on this blog). in 2024 (around 2.6% Q4-over-Q4).
Earlier I posted some questions on my blog for next year: Ten Economic Questions for 2025. Some of these questions concern real estate (inventory, house prices, housing starts, new home sales), and I posted thoughts on those in the newsletter (others like GDP and employment will be on this blog).
The key reports this week are January CPI and Retail sales. Fed Chair Powell presents the Semiannual Monetary Policy Report to the Congress on Tuesday and Wednesday. -- Monday, February 10th -- No major economic releases scheduled. -- Tuesday, February 11th -- 6:00 AM: NFIB Small Business Optimism Index for January.
The key reports this week are June CPI, Retail Sales and Housing Starts. 2:00 PM: the Federal Reserve Beige Book , an informal review by the Federal Reserve Banks of current economic conditions in their Districts. -- Thursday, July 17th -- 8:30 AM: The initial weekly unemployment claims report will be released. increase in core CPI.
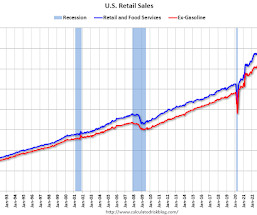
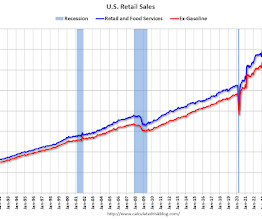
The key reports this week are February Retail sales, Housing Starts and Existing Home Sales. increase in retail sales. This graph shows retail sales since 1992. This is monthly retail sales and food service, seasonally adjusted (total and ex-gasoline). The FOMC meets this week, and no change to policy is expected.
Fed Chair Powell speaks on the economic outlook on Friday. -- Monday, March 3rd -- 10:00 AM: ISM Manufacturing Index for February. All day: Light vehicle sales for February. Sales were at 15.6 Sales were at 15.6 The consensus is for an increase in sales to 15.9 The consensus is for the ISM to be at 50.8,
Excerpt: Earlier I posted some questions on my blog for next year: Ten Economic Questions for 2025. Some of these questions concern real estate (inventory, house prices, housing starts, new home sales), and Ill post thoughts on those in this newsletter (others like GDP and employment will be on my blog).
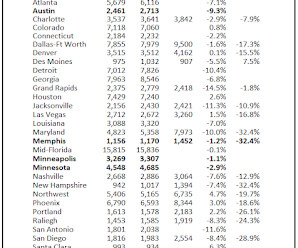
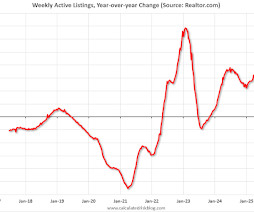
from a year ago The number of homes actively for sale remains significantly higher than last year, continuing a 75-week streak of annual gains. In particular, recent economic uncertainty and concerns around job security could keep buyers on the sidelines, potentially applying downward pressure on prices. New listings were up 12.8%
Any number below 50 indicates that more builders view sales conditions as poor than good. Builders expect future trade negotiations and progress on tax policy will help stabilize the economic outlook and strengthen housing demand. The use of sales incentives was 61% in May, the same rate as the previous month.
Early in February , I expressed my "increasing concern" about the negative economic impact of "executive / fiscal policy errors", however, I concluded that post by noting that I was not currently on recession watch. This graph shows the YoY change in New Home Sales from the Census Bureau. Light vehicle sales in May (15.65
This was lower than last year and suggests slightly less real retail sales this holiday season as last year. Part Time for Economic Reasons From the BLS report : " The number of people employed part time for economic reasons was little changed at 4.6 This was seasonally adjusted (SA) to a loss of 6.4 YoY in October.
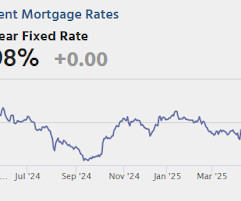
Closed sales in March were mostly for contracts signed in January and February when 30-year mortgage rates averaged 6.96% and 6.84%, respectively (Freddie Mac PMMS). This was before the recent surge in economic uncertainty and stock market volatility that might impact existing home sales.
The key reports this week are June New and Existing Home Sales. 10:00 AM: Existing Home Sales for June from the National Association of Realtors (NAR). . -- Wednesday, July 23rd -- 7:00 AM ET: The Mortgage Bankers Association (MBA) will release the results for the mortgage purchase applications index. The consensus is for 4.00
Today, in the Calculated Risk Real Estate Newsletter: A Proposal to Address the Housing Crisis Brief excerpt: Economist Adam Ozimek and John Lettieri (CEO, Economic Innovation Group) have a new proposal to address the housing crisis in the United States: How the next president can solve America’s housing crisis U.S.
Michael joined AssetMark in 2010 and has held a number of leadership positions, including Head of National Sales and Consulting, Chief Client Officer, and President (2021–Present). Michael received his Bachelor of Arts in Economics from the University of California, Los Angeles.
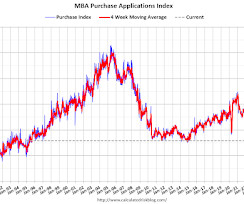
Treasury yields continue to be volatile as economic uncertainty dominates markets. Overall purchase activity has shown year-over-year growth for more than two months as the inventory of existing homes for sale continues to increase, a positive development for the housing market despite the uncertain near-term outlook.
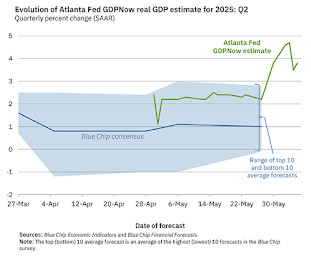
We boosted our Q2 GDP tracking estimate by 0.4pp to +3.7% (quarter-over-quarter annualized ) and left our Q2 domestic final sales estimate unchanged at -0.5%. June 5th estimate] And from the Atlanta Fed: GDPNow The GDPNow model estimate for real GDP growth (seasonally adjusted annual rate) in the second quarter of 2025 is 3.8 percent and 0.5
Early in February , I expressed my "increasing concern" about the negative economic impact of "executive / fiscal policy errors", however, I concluded that post by noting that I was not currently on recession watch. This graph shows the YoY change in New Home Sales from the Census Bureau. Then sales were depressed in May and June.
Earlier I posted some questions on my blog for next year: Ten Economic Questions for 2025. Some of these questions concern real estate (inventory, house prices, housing starts, new home sales), and I posted thoughts on those in the newsletter (others like GDP and employment will be on this blog). year-over-year as of November.
The key reports this week are May Retail Sales and Housing Starts. up from -9.2. -- Tuesday, June 17th -- 8:30 AM: Retail sales for May is scheduled to be released. decrease in retail sales. This graph shows retail sales since 1992. The consensus is for a reading of -6.0, The consensus is for a 0.5%
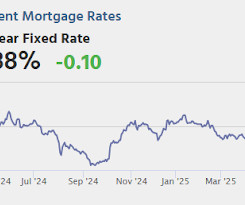
Of all of the days this week, Monday was the best candidate for a ho-hum level of movement because it was the only day without any major economic data on tap. This was originally a GSE only repeat sales, however there is also an expanded index. • Rates are based on bonds, and econ data is a key source of inspiration for bonds. [
The key reports this week are July CPI and Retail Sales. For manufacturing, the August NY Fed survey, and the July Industrial Production report will be released. -- Monday, August 11th -- No major economic releases scheduled. -- Tuesday, August 12th -- 6:00 AM ET: NFIB Small Business Optimism Index for July. increase in retail sales.
jeffreyptak.substack.com) Global China is more diverse (economic) than you think. propublica.org) Economy Retail sales are decelerating. (morningstar.com) People are not dumping target date funds willy-nilly. scottsumner.substack.com) What do we lose if the world turns against the U.S.? paulkrugman.substack.com) The U.S.
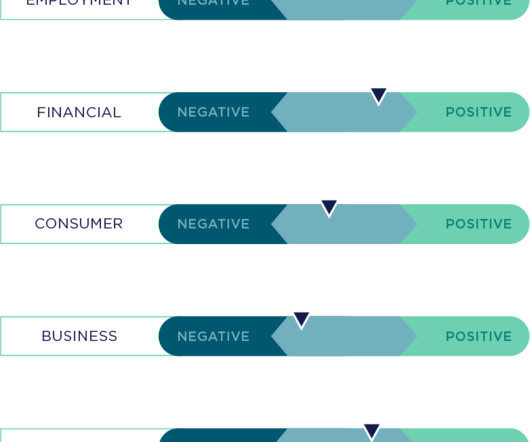
Key takeaways: Economic activity was downshifted by mid-year, with elevated interest rates and inflation fatigue weighing on consumer and business spending behavior. The less frothy economic data provide more reason for the Federal Reserve to start lowering interest rates in the second half of 2024.
The key reports this week are December CPI, retail sales, and housing starts. 2:00 PM: the Federal Reserve Beige Book , an informal review by the Federal Reserve Banks of current economic conditions in their Districts. -- Thursday, January 16th -- 8:30 AM: The initial weekly unemployment claims report will be released. down from 0.2.
We organize all of the trending information in your field so you don't have to. Join 36,000+ users and stay up to date on the latest articles your peers are reading.
You know about us, now we want to get to know you!
Let's personalize your content
Let's get even more personalized
We recognize your account from another site in our network, please click 'Send Email' below to continue with verifying your account and setting a password.


Let's personalize your content