This site uses cookies to improve your experience. To help us insure we adhere to various privacy regulations, please select your country/region of residence. If you do not select a country, we will assume you are from the United States. Select your Cookie Settings or view our Privacy Policy and Terms of Use.
Cookie Settings
Cookies and similar technologies are used on this website for proper function of the website, for tracking performance analytics and for marketing purposes. We and some of our third-party providers may use cookie data for various purposes. Please review the cookie settings below and choose your preference.
Used for the proper function of the website
Used for monitoring website traffic and interactions
Cookie Settings
Cookies and similar technologies are used on this website for proper function of the website, for tracking performance analytics and for marketing purposes. We and some of our third-party providers may use cookie data for various purposes. Please review the cookie settings below and choose your preference.
Strictly Necessary: Used for the proper function of the website
Performance/Analytics: Used for monitoring website traffic and interactions
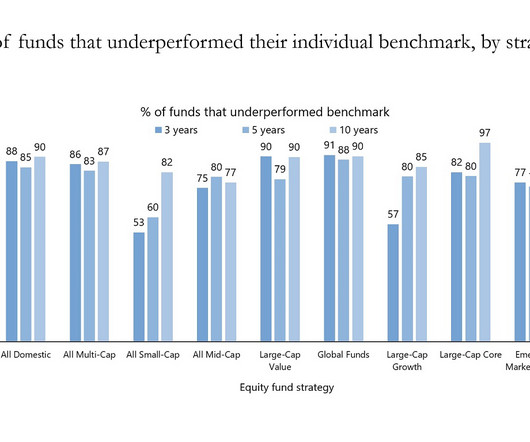
Sometimes, the data is so overwhelming that little commentary is needed. From SPIVA , here is the data on large-cap fund performance in the United States, showing the percentage of all large-cap funds that over and underperformed the S&P 500 over various time frames: 1 Year: 65.24% of funds underperformed the S&P 500; 34.76% outperformed the S&P 500 3 Years: 84.96% underperformed; 15.04% outperformed 5 Years: 76.26% underperformed; 23.74% outperformed 10 Years: 84.34% underperformed;
Most analysts expect no change to FOMC policy at the meeting this week, keeping the target range at 4 1/4 to 4 1/2 percent. Market participants currently expect the FOMC to also be on hold at the July meeting, with the next rate cut in September, and a second rate cut in December. From BofA: The Fed has made it clear that the policy rate will remain unchanged at its June meeting.
For investors, the prudent path remains clear—embrace low-cost, systematically managed funds and let the odds work in your favor as opposed to active management.
Enjoy the current installment of "Weekend Reading For Financial Planners" – this week's edition kicks off with the news that a recent report finds that the number of SEC-registered RIAs, the assets that they manage, and the number of clients they serve all increased between 2023 and 2024 and suggests the industry is robust across the size spectrum, with both smaller and mid-sized firms seeing growth (often pushing them into higher size brackets and/or from state to SEC registration) and re
Automation generally supercharges any process and brings its value to the forefront. See how infusing automation such as ART (our month-end close solution), into your close can get you to the next level of closing. We will share a live demo of SkyStem's solution, ART and share the key elements of month-end close automation. Through ART, we'll take a look at: What month-end close automation entails Which process steps can and should be automated Benefits of achieving process automation, and Why i
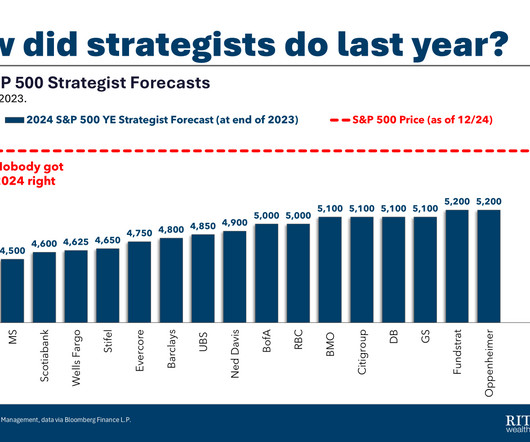
A regular theme around these parts is “ Nobody Knows Anything. ” Specifically, nobody knows what will happen in the future. This is true about equity and bond markets, specific company stocks, and economic data series. We do not know which geopolitical hot spot will erupt in turmoil; we have no idea where or when the next natural disaster will hit.
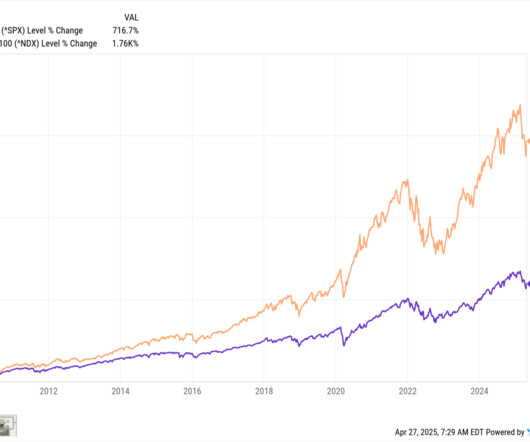
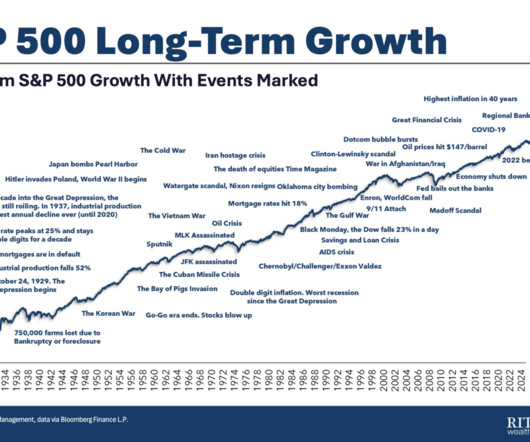
We have no idea how good we had it. Lets consider the returns data from the period post-Great Financial Crisis (GFC), and then unpack what it might mean. Starting January 1, 2010, the S&P 500 generated a total return (with dividends reinvested) of 566.8% , or 13.3% per year from the start of 2010 through the end of Q1 2025. The Nasdaq 100 has nearly doubled that.
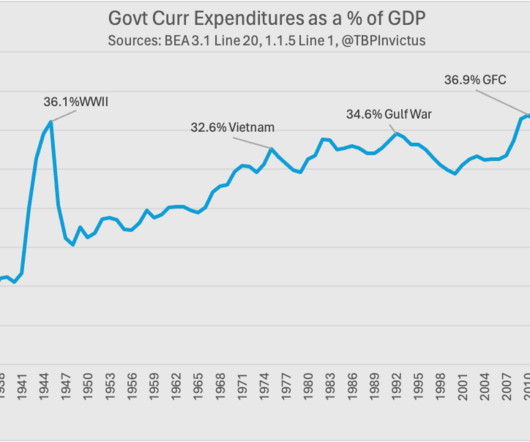
Calculation: BEA Table 3.1 Line 20 (Current Expenditures) divided by Table 1.1.5 Line 1 (GDP). Alternatively, Item #2 below divided by GDP. “ If you torture data long enough, it will confess to anything. ” – Ronald Coase Hey, it’s @TBPInvictus. Let’s delve into a case in point of Coase’s theorem: If you wanted to peddle the narrative that government spending is out of control, you might present a chart like the one above, which is an exact replica of a chart t
Calculation: BEA Table 3.1 Line 20 (Current Expenditures) divided by Table 1.1.5 Line 1 (GDP). Alternatively, Item #2 below divided by GDP. “ If you torture data long enough, it will confess to anything. ” – Ronald Coase Hey, it’s @TBPInvictus. Let’s delve into a case in point of Coase’s theorem: If you wanted to peddle the narrative that government spending is out of control, you might present a chart like the one above, which is an exact replica of a chart t
Since March Madness is nearly upon us, how about a fun basketball story? I was lucky enough to be a hoops fan during the golden age of basketball: Larry Bird and Magic Johnson, the Bad Boy Detroit Pistons, Michael Jordan, and the perennially-on-the-verge-of-winning-it-all New York Knicks during the Patrick Ewing, John Starks, Charles Oakley, Anthony Mason era.
Bill Ramsay, the founder of Financial Symmetry, grew his RIA Edge 100 RIA firm organically with shared employee ownership and an internship program that has led to a young, invested team.
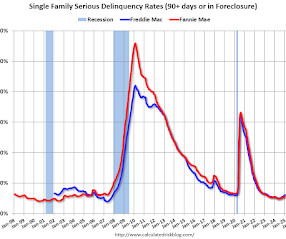
Today, in the Calculated Risk Real Estate Newsletter: Fannie and Freddie: Single Family Serious Delinquency Rates Increased in January Excerpt: Freddie Mac reported that the Single-Family serious delinquency rate in January was 0.61%, up from 0.59% December. Freddie's rate is up year-over-year from 0.55% in January 2024, however, this is close to the pre-pandemic level of 0.60%.
First, lets go to the data (via Bloomberg ): 5,502,284% That is the per-share market value increase of Berkshire Hathaway stock from 1964 to 2024. Compare that with the SPX total returns of 39,054%; BRK annualized returns are ~20%, about double that of the S&P over the same period. Those mouthwatering returns have led to a cottage industry of imitators, analytical copycats, and flattering wannabes.
In the climb from contributor to leader, the rules quietly change. If you’re aiming for the summit, the air gets thinner—and what got you here won’t be enough to get you to the top (a concept first popularized by Marshall Goldsmith in his book What Got You Here Won’t Get You There ). What made you successful early in your finance career—technical accuracy, sharp analysis, flawless execution—won’t be what carries you to the next level.
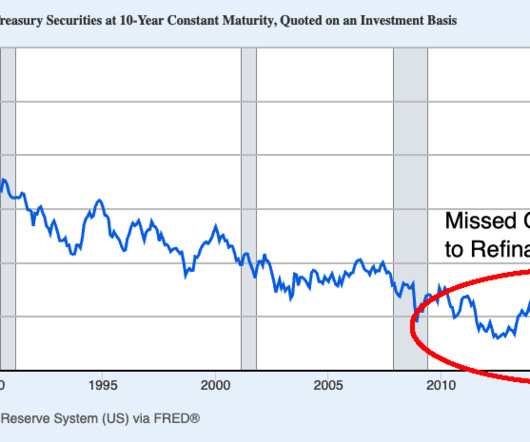
I’m on the road visiting our new office in Chicago and then heading to meet clients in San Francisco. However, after hearing some misinformation on TV from the usual suspects, I felt compelled to remind people of some key facts about the US debt and deficits. For a period of ~20 years, beginning after the September 11th attack, accelerating after the GFC, and running up until the 2022 rate hikes, the United States enjoyed incredibly low interest rates.
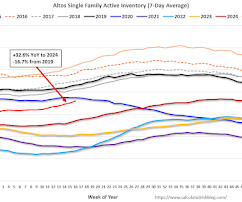
Altos reports that active single-family inventory was up 2.4% week-over-week. Inventory is now up 15.2% from the seasonal bottom in January and is increasing. Usually, inventory is up about 6% or 7% from the seasonal low by this week in the year. So, 2025 is seeing a larger than normal pickup in inventory. The first graph shows the seasonal pattern for active single-family inventory since 2015.
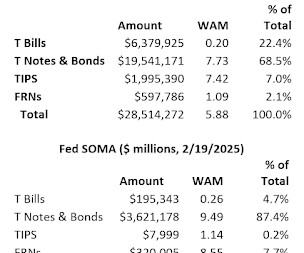
From housing economist Tom Lawler: Treasury Secretary Wrongly Says Fed Has Been Big Seller of Treasuries In an interview last week, Treasury Secretary Bessent said that any plans by the Treasury to extend the maturity were a long ways off. One of the reasons cited by Secretary Bessent was the Federal Reserves current balance sheet runoff policy. Here is a quote from Bessent.
BlackRock made another move to bolster its private market capabilities with the acquisition of net lease real estate firm ElmTree Funds. Private investment platform Linqto, which promised access to pre-IPO firms, filed for bankruptcy amid SEC scrutiny of its practices. These are among the investment must-reads we found this week for financial advisors.
The most overlooked, yet most critical, element of transformation is preparing people for change. Automation and AI aren't just technical upgrades, they’re cultural shifts which can challenge identities. That’s why change management isn’t a side project—it’s the foundation. In finance, where precision and process rule, navigating change can feel especially disruptive.
More than a dozen asset managers have updated regulatory filings to drop accredited investor restrictions in the wake of a recent SEC decision, reports FundFire. Despite the recent rush to private markets, venture capital has struggled compared to other asset classes, according to PitchBook. These are among the investment must-reads we found this week for financial advisors.
The Department of Labor rescinded its 2022 guidance cautioning against cryptocurrency in 401(k) plans, reaffirming a neutral stance on digital assets in retirement accounts.
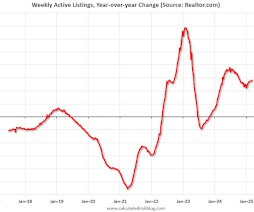
What this means: On a weekly basis, Realtor.com reports the year-over-year change in active inventory and new listings. On a monthly basis, they report total inventory. For February, Realtor.com reported inventory was up 27.5% YoY, but still down 22.9% compared to the 2017 to 2019 same month levels. Now - on a weekly basis - inventory is up 28.5% YoY.
WealthManagement.com is part of the Informa Connect Division of Informa PLC INFORMA PLC | ABOUT US | INVESTOR RELATIONS | TALENT This site is operated by a business or businesses owned by Informa PLC and all copyright resides with them. Informa PLC's registered office is 5 Howick Place, London SW1P 1WG. Registered in England and Wales. Number 8860726.
Where are top advisors focusing in 2025? AcquireUp’s 2025 Industry Index reveals it all. Based on insights from 200+ financial professionals nationwide, discover why 74% say seminars and referrals deliver the best ROI, how automation is helping advisors scale faster, and why only 8% are tapping into niche marketing (a major growth opportunity!). Whether you're refining your client acquisition strategy or scaling your practice, this report gives you the real-world data, benchmarks, and action ste
Brent Brodeski discusses how AI and fintech advancements are transforming wealth management, urging RIAs to adapt and seize value creation opportunities.
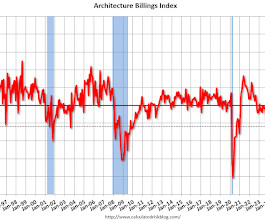
Note: This index is a leading indicator primarily for new Commercial Real Estate (CRE) investment. From the AIA: ABI December 2024: Business conditions end the year on a weak note The AIA/Deltek Architecture Billings Index (ABI) score fell to 44.1 for the month as the share of firms reporting a decline in firm billings increased. Firm billings have now decreased for the majority of firms every month except two since October 2022.
RIA and investment leaders at Wealth Management EDGE said future-ready firms will expand revenue via adjacent services and cultivate second-generation advisors through tactics including equity stakes.
Speaker: Claire Grosjean, Global Finance & Operations Executive
Finance teams are drowning in data—but is it actually helping them spend smarter? Without the right approach, excess spending, inefficiencies, and missed opportunities continue to drain profitability. While analytics offers powerful insights, financial intelligence requires more than just numbers—it takes the right blend of automation, strategy, and human expertise.
I discussed much of this in my Q2 2025 RWM client quarterly call on April 5. I am sharing this now because so many questions have poured in. Best Worst Cases Last Monday, I discussed the consequences of chaos. While the purposes of the new tariff policy were not well explained some of the goals were muddled and unclear it seems a large part of the problem was the roll-out.
Ritholtz Wealth Management relocates its Chicago office to The Salt Shed, emphasizing the importance of physical workspace in attracting talent and fostering collaboration.
Modern Wealth’s fourth deal of 2025, and 17th since its founding in 2023, adds a firm in its home state and bolsters a workplace retirement plan division launched last year via acquisition.
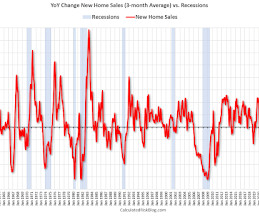
This morning, Carl Quintanilla posted a graph on Bluesky from BESPOKE suggesting the US is heading towards a recession. Quintanilla quoted BESPOKE: On a 12-month average basis, Housing Starts have completely rolled over from their peak. . Recessions have always followed a rollover in Housing Starts, and the only question is timing. Housing is the basis of one of my favorite models for business cycle forecasting.
Your financial statements hold powerful insights—but are you truly paying attention? Many finance professionals focus on the income statement while overlooking key signals hidden in the balance sheet and cash flow statement. Understanding these numbers can unlock smarter decision-making, uncover risks, and drive long-term success. Join David Worrell, accomplished CFO, finance expert, and author, for an engaging, nontraditional take on reading financial statements.
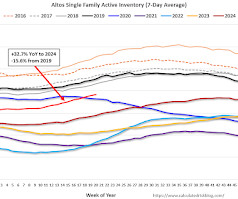
Altos reports that active single-family inventory was up 1.5% week-over-week. Inventory is now up 22.9% from the seasonal bottom in January and is increasing. Usually, inventory is up about 13% from the seasonal low by this week in the year. So, 2025 is seeing a larger than normal pickup in inventory. The first graph shows the seasonal pattern for active single-family inventory since 2015.
Fed Chair Powell press conference video here or on YouTube here , starting at 2:30 PM ET. FOMC Statement: Recent indicators suggest that economic activity has continued to expand at a solid pace. The unemployment rate has stabilized at a low level in recent months, and labor market conditions remain solid. Inflation remains somewhat elevated. The Committee seeks to achieve maximum employment and inflation at the rate of 2 percent over the longer run.
From the Fed: Minutes of the Federal Open Market Committee, March 1819, 2025. Excerpt: With regard to the outlook for inflation, participants judged that i nflation was likely to be boosted this year by the effects of higher tariffs, although significant uncertainty surrounded the magnitude and persistence of such effects. Several participants noted that the announced or planned tariff increases were larger and broader than many of their business contacts had expected.
WealthManagement.com is part of the Informa Connect Division of Informa PLC INFORMA PLC | ABOUT US | INVESTOR RELATIONS | TALENT This site is operated by a business or businesses owned by Informa PLC and all copyright resides with them. Informa PLC's registered office is 5 Howick Place, London SW1P 1WG. Registered in England and Wales. Number 8860726.
Automation is transforming finance but without strong financial oversight it can introduce more risk than reward. From missed discrepancies to strained vendor relationships, accounts payable automation needs a human touch to deliver lasting value. This session is your playbook to get automation right. We’ll explore how to balance speed with control, boost decision-making through human-machine collaboration, and unlock ROI with fewer errors, stronger fraud prevention, and smoother operations.
We organize all of the trending information in your field so you don't have to. Join 36,000+ users and stay up to date on the latest articles your peers are reading.
You know about us, now we want to get to know you!
Let's personalize your content
Let's get even more personalized
We recognize your account from another site in our network, please click 'Send Email' below to continue with verifying your account and setting a password.


Let's personalize your content