Trends in Educational Attainment in the U.S. Labor Force
Calculated Risk
MAY 11, 2025
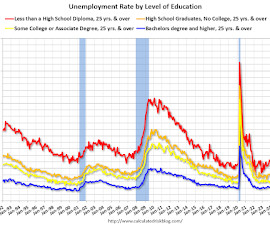
The first graph shows the unemployment rate by four levels of education (all groups are 25 years and older) through April 2025. Note: This is an update to a post from several years ago. Unfortunately, this data only goes back to 1992 and includes only three recessions (the stock / tech bust in 2001, and the housing bust/financial crisis, and the 2020 pandemic).


Let's personalize your content