article thumbnail

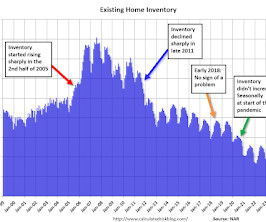
Watch Inventory and Why Measures of Existing Home Inventory appear Different

Calculated Risk

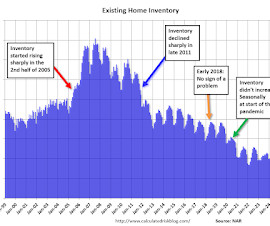
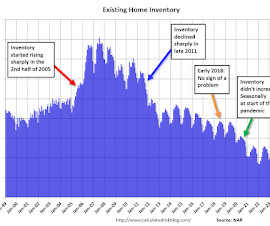
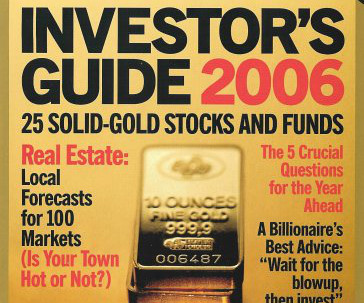
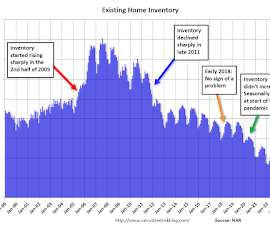
Watch Inventory Here are a few examples of when inventory helped me call some turning points for house prices (this section is an update to a previous article): Starting in January 2005, I was very bearish on housing , but I wasnt sure when the market would turn. Speculative bubbles can go on and on.

Marketing 191
article thumbnail

U.S. Courts: Bankruptcy Filings Increase 14 Percent in 2024; 33% Below Pre-Pandemic Levels

Calculated Risk

The sharp decline in 2006 was due to the so-called "Bankruptcy Abuse Prevention and Consumer Protection Act of 2005". This graph shows the business and non-business bankruptcy filings by calendar year since 1997. 2024 was the 4th lowest year for bankruptcy filings, and 33% below the pre-pandemic level in 2019.

189
189
Insiders

Sign Up for our Newsletter

This site is protected by reCAPTCHA and the Google Privacy Policy and Terms of Service apply.

article thumbnail

The Housing Bubble and Mortgage Debt as a Percent of GDP

Calculated Risk

In a 2005 post , I included a graph of household mortgage debt as a percent of GDP. First, from February 2005 (20 years ago!): The bottom line remains the same: There will not be cascading price declines in this cycle due to distressed sales. Several readers asked if I could update the graph.

Economy 147
article thumbnail

Question #1 for 2025: How much will the economy grow in 2025? Will there be a recession in 2025?

Calculated Risk

Here is a table of the annual change in real GDP since 2005. Real GDP Growth Year Annual GDP Q4 / Q4 2005 3.5% There are several geopolitical issues that could lead to recession - in Ukraine, the Middle East, and with China. However, none of those risks appear likely to cause a U.S. recession this year. For 2024, I used a 2.6%

Economy 173
article thumbnail

Updating My Favorite Performance Chart For 2024

A Wealth of Common Sense

The first asset allocation quilt I created for this site covered the ten-year period from 2005-2014. Those returns look nothing like the last 10 years which is the whole point of this exercise. Here’s the latest quilt: Some observations: Inflation outperformed TIPS.The average inflation rate over the past 10 years was around 2.9%

article thumbnail

Employment Report Forecasts

Calculated Risk

In September 2005, the initial BLS report showed a loss of 35 thousand jobs due to the impact of Hurricanes Katrina and Rita (Katrina hit in late August, and Rita during the reference period in September). The consensus is for 120,000 jobs added, and for the unemployment rate to be unchanged at 4.1%.

182
182
article thumbnail

Fannie Mae: Mortgage Serious Delinquency Rate Decreased in September

Calculated Risk

For loans made in 2005 through 2008 (1% of portfolio), 3.83% are seriously delinquent (down from 3.95%), For recent loans, originated in 2009 through 2021 (98% of portfolio), 0.55% are seriously delinquent (down from 0.57%).

Portfolio 363