Here are some things I think I am thinking about this weekend:
1) China’s Long Stock Malaise.
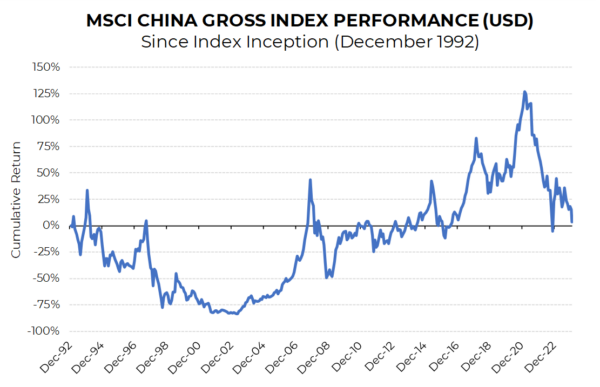
Here’s the stock market chart of the decade (via Jake Econompic at Twitter). Or decades. Since 1992 the Chinese economy has grown from $500B to $18T. That’s trillion with a T. Yet the Chinese stock market has gone exactly nowhere over the same period.
People always like to say that the stock market isn’t the economy, but this one is really mind blowing. It’s almost impossible to believe that the economy could grow so much without accruing any value to the corporations in that economy.
Now, there are lots of reasons why this might happen. First, this chart is in USD and the RMB has experienced about a 40% devaluation since 1992. There’s also an issue of dilution in many emerging markets where new share issuance is excessive in the process of funding new (fast) growing firms. But even with all of this it’s still hard to believe.
This is (part of) why I am such a big advocate of global stock exposure. Not only does it give you a currency hedge, but it also gives you a domestic economic, political and business hedge. Of course, US based investors will say you don’t need to invest outside the USA, but that sort of thinking always makes me wary. Yes, the US economy is very unique for many reasons, but the idea that something similar to this cannot happen in the USA is a bet that no one needs to make. And after Covid I think we can all agree that we should expect the unexpected.
2) The US Stock Malaise (Or Boom?)
Speaking of outstanding US stock performance – the headlines in financial markets in the coming weeks will be all about the new highs in US stocks. But is it a new high or is it a multi-year malaise? After all, the US stock market hasn’t done much over the last two years. If you’d gone to sleep at the end of 2021 and just woken up you might think that nothing happened over the last two years.
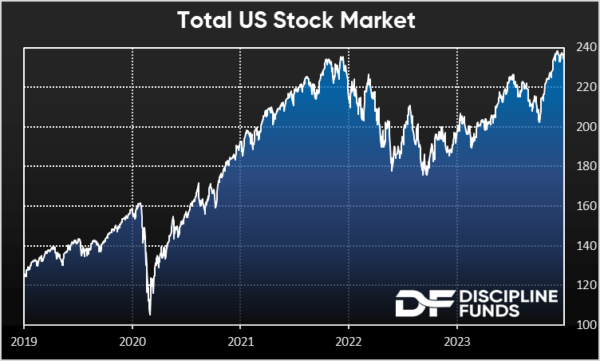
Of course, this is just a very miniature malaise compared to something like the aforementioned chart, but it’s worth keeping in mind as we navigate time. I like to emphasize the idea that the stock market is a multi-decade instrument. If you buy a global stock allocation you’re very likely to generate high single digit returns over a multi-decade period. What that instrument does over a year or two years or even 10 years is an unknown. But if you’re willing to be patient with it you should do well.
Still, this chart is interesting in the context of the Chinese chart. The USA is absolutely not China, but that’s the basic premise of diversification. You don’t concentrate all your risk in one place and that ends up meaning that there will be times where you hate parts of your portfolio. But in the long-run the diversification creates better returns because you don’t have the kind of concentration risk that can nuke investment portfolios.
3) How I Think About US Government Debt.
As we watch another debt ceiling debate unfold there’s growing angst over the supply of US government debt. I have a somewhat unique way of viewing US government debt so I’ll lay out my thinking there.
- Government debt is an aggregated instrument of many entities and never gets paid back so don’t think of government debt like a household’s debt (aggregate household debt also doesn’t get paid back).
- Government debt is especially unique in that it’s typically a money-like instrument. A 3 month T-Bill is basically just a dollar bill that pays interest. So it could be helpful to think of all government debt as if it’s something more like physical cash as opposed to being similar to a corporate bond.
This macro framework is useful because it shows how unique government debt is and how different it is from a household’s debt or a corporation’s debt. Most of us think about government debt or even aggregated sectoral debt like household debt. You have to be prudent and pay down your debts over time. But the only reason one household can pay down debts is because another household or sector is adding debt. This whole process isn’t necessarily good or bad. Debt can be good and it can be bad. It really depends on what the debt is used for.
So now ask yourself what would happen if the government didn’t issue bonds at all? What if they just issued 3 month TBills for instance. Or actual cash as they spent? What would be that different? Not much really. But the more important aspect of this thought exercise is in understanding where the impact is seen. Instead of thinking about the interest rate on debt you now have to consider where the “cost” of new liabilities shows up. After all, if the government just issued cash you wouldn’t see an interest rate at all. And if the government just issued cash then you’d see the “cost” of new debt issuance show up as inflation.
So many people like to think of the supply of government bonds as if they’re similar to an individual corporate bond. But when you think of a government bond as if it’s just cash then you have to reposition your thinking and only consider the aggregated impact on inflation. And then you get into a debate about what causes inflation and whether the government’s new liability issuance is the dominant driving force in inflation. It certainly can be. That’s the main reason I was much more worried about high inflation coming out of Covid. But in the context of how “sustainable” government debt issuance is you really have to consider one thing and one thing only – how will new bond issuance impact inflation and is government “debt” issuance the dominant factor driving current inflation.
The lesson here is that it’s counterproductive to think of government debt in isolation. Once you reposition it to an aggregated economic perspective you can then begin to think about government debt as a relative factor in causing inflation.