Merger arbitrage is an investment style in which investors seek to buy shares of firms that are acquisition targets with the objective of realizing the difference between the amount for which the target is being acquired and the stock price of the target shortly after the acquisition is announced. The stock price of the target company typically sells below the acquisition price, reflecting the uncertainty of the deal being completed (the arbitrage spread). Betting on mergers is a classic hedge fund arbitrage strategy.
Reflecting the uncertainty, and the fact that historically about 90% of merger deals are completed, there’s a premium to be earned. Another reason for the premium is that the return distribution is negatively skewed (most of the returns are small positives, but the downside risk is large if the buyout premium was substantial and the deal is not completed). In other words, merger arbitrage is not pure arbitrage, which is a riskless trade involving the simultaneous purchase and sale of the same or similar asset in different markets to profit from small differences in the asset’s price. Investors dislike negative skewness, demanding premiums for accepting that risk. Mark Mitchell and Todd Pulvino, authors of the 2001 study “Characteristics of Risk and Return in Risk Arbitrage,” found that “arbitrage returns are positively correlated with market returns in severely depreciating markets but uncorrelated with market returns in flat and appreciating markets.” Investors demand a premium for taking risks that tend to appear in bad times. The negative skewness highlights the risks of merger arbitrage funds that use leverage to enhance returns.
Thanks to Portfolio Visualizer, we can examine the performance of The Merger Fund (MERFX), the largest merger arbitrage mutual fund, with about $3.9 billion in assets under management; the IQ Merger Arbitrage ETF (MNA), the largest of its kind, with about $460 million in assets under management; and AQR’s Diversified Arbitrage (ADAIX) mutual fund, with about $1.7 billion in assets under management. The most extended period for which data was available for all three is December 2009-February 2023.
| MERFX | MNA | ADAIX | |
| Annualized Return (%) | 2.8 | 2.1 | 4.0 |
| Standard Deviation (%) | 2.8 | 5.2 | 5.2 |
| Sharpe Ratio | 0.78 | 0.30 | 0.66 |
| Market Correlation | 0.53 | 0.49 | 0.42 |
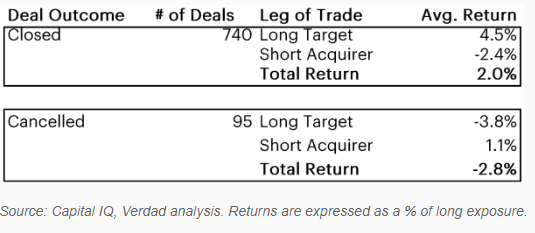
To understand the sources of risk and return of merger arbitrage strategies, the research team at Verdad built a database of 835 deals between 2000 and 2020 using data from Capital IQ. They employed a simple strategy: Five days after the deal announcement, they went long the target. If the acquirer paid in stock, they also shorted the acquirer in accordance with the exchange ratio. These positions were held until the deal either closed or failed. About 40 deals per year met their criteria, of which 89% closed successfully. They found that the arbitrageur earned about 2.0% on the successful deals and lost 2.8% on canceled deals, for a blended average 1.5% return on long exposure if they were to bet on every merger.
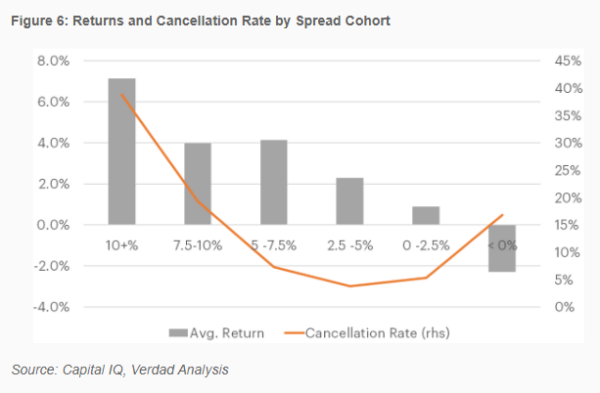
Their research also found that high merger arbitrage spreads were correlated with higher cancellation rates—the market is efficient, as it discounts deals that are likely to fail by pricing the target lower. The result was that deals with higher spreads (reflecting greater risk of failure) generated higher returns despite the drag caused by higher cancellation rates – deals with spreads between 5% and 7.5% returned 4.0% on average, while deals with spreads between 0% and 2.5% returned just 0.90%.
The results are hypothetical results and are NOT an indicator of future results and do NOT represent returns that any investor actually attained. Indexes are unmanaged and do not reflect management or trading fees, and one cannot invest directly in an index.
They also found that the long position in the target generated all the returns for deals that closed, while shorting the acquirer (if applicable) detracted on average. However, for deals that broke, the short acquirer position contributed 110 basis points, reducing the volatility of the return distribution.
The results are hypothetical results and are NOT an indicator of future results and do NOT represent returns that any investor actually attained. Indexes are unmanaged and do not reflect management or trading fees, and one cannot invest directly in an index.
Verdad’s research also found that merger arbitrage returns are negatively correlated with high-yield spreads: “We believe higher spreads cause deal failure directly by making it more difficult and expensive for cash acquirers to secure financing. Higher spreads also indicate greater risk aversion and price volatility, which decreases the likelihood of risky acquisitions closing. When deals break, merger arbs lose money.”
Their findings led Verdad to conclude: “A merger arbitrage strategy might be quite beneficial to already diversified investors. Using Fidelity’s merger arbitrage mutual fund as the basis for our return series, we found that the addition of merger arbitrage to an ‘all-weather’ style portfolio could improve the Sharpe ratio by over 0.05 when used as a partial substitute for high-yield credit. This is because they have similar return profiles, but the merger arbitrage strategy was broadly less correlated with other assets – both equity and debt – than was high-yield.”
As one would expect, the size of the arbitrage spread depends on supply and demand conditions. Zaur Rzakhanov and Gaurav Jetley, authors of the 2019 study, “Competition Scale and Hedge Fund Performance: Evidence from Merger Arbitrage,” found strong evidence of diseconomies of scale in merger arbitrage – as capital flowed into the strategy, the trade got crowded and the spread narrowed. Popularity contains the seeds of destruction.
For informational and educational purposes only and should not be construed as specific investment, accounting, legal, or tax advice. Certain information is based on third party data and may become outdated or otherwise superseded without notice. Third party information is deemed to be reliable, but its accuracy and completeness cannot be guaranteed. Mentions of specific securities are for informational purposes only and should not be construed as a recommendation of said securities. By clicking on any of the links above, you acknowledge that they are solely for your convenience, and do not necessarily imply any affiliations, sponsorships, endorsements or representations whatsoever by us regarding third-party websites. We are not responsible for the content, availability, or privacy policies of these sites, and shall not be responsible or liable for any information, opinions, advice, products or services available on or through them. Neither the Securities and Exchange Commission (SEC) nor any other federal or state agency have approved, determined the accuracy, or confirmed adequacy of this article. The opinions expressed here are their own and may not accurately reflect those of Buckingham Strategic Wealth, LLC or any of its affiliates. LSR-23-470

About the Author: Larry Swedroe
—
Important Disclosures
For informational and educational purposes only and should not be construed as specific investment, accounting, legal, or tax advice. Certain information is deemed to be reliable, but its accuracy and completeness cannot be guaranteed. Third party information may become outdated or otherwise superseded without notice. Neither the Securities and Exchange Commission (SEC) nor any other federal or state agency has approved, determined the accuracy, or confirmed the adequacy of this article.
The views and opinions expressed herein are those of the author and do not necessarily reflect the views of Alpha Architect, its affiliates or its employees. Our full disclosures are available here. Definitions of common statistics used in our analysis are available here (towards the bottom).
Join thousands of other readers and subscribe to our blog.