In our book, “The Incredible Shrinking Alpha,” Andrew Berkin and I showed evidence demonstrating that it has become increasingly difficult for active managers to generate alpha (performance against an appropriate risk-adjusted benchmark). We provided four explanations for why, over the prior 20 years, the percentage of active managers who were able to generate statistically significant alpha fell from about 20% to less than 2%:
- Academic research has been converting what was once alpha into beta (a common trait or characteristic such as size, value, profitability/quality, and momentum that can be replicated by systematic strategies).
- The pool of victims that can be exploited has been shrinking. Because alpha is a negative sum game after costs, for there to be winners, there must be victims who can be exploited. While retail investors underperform on average, the percentage of stocks held directly by individual investors in their brokerage accounts has collapsed since WWII (from about 90% to about 20% by 2008), leaving fewer victims for the sophisticated institutional investors to exploit.
- The competition has been getting more challenging. Over the past 50 years, increasing numbers of highly talented investment professionals have entered the competition with more advanced training than their predecessors, better analytical tools, and faster access to more information. Today, legendary hedge funds, such as Renaissance Technology, SAC Capital Advisors, and D.E. Shaw, hire Ph.D. scientists, mathematicians, and computer scientists. MBAs from top schools, such as Chicago, Wharton, and MIT, flock to investment management armed with powerful computers and massive databases. The unsurprising result is that it has become more difficult to generate alpha after costs.
- The supply of dollars chasing the shrinking pool of alpha opportunities has increased. For example, 25 years ago, there was about $300 billion in hedge funds. Today that figure is about $5 trillion. In addition, so-called “smart beta” ETFs have total assets under management of approximately $1.7 trillion.
Another problem for active management is that publishing empirical academic research breeds familiarity with previously successful investment opportunities. Familiarity breeds investment, leading to a reduction or even elimination (especially if the premium has a behavioral explanation) of factor premiums. David McLean and Jeffrey Pontiff, authors of the 2016 study “Does Academic Research Destroy Stock Return Predictability,” found that the average characteristic’s return has a “56% post-publication decay.” The decay occurred as institutional investors increasingly adopted factor-based investment strategies derived from academic research. McLean and Pontiff also found that “strategies concentrated in stocks that are more costly to arbitrage have higher expected returns post-publication”—limits to arbitrage (costs and risks of shorting) can prevent sophisticated investors from eliminating the premium.
Another explanation for declining premiums was provided by Tarun Chordia, Avanidhar Subrahmanyam, and Qing Tong, authors of the 2014 study “Have Capital Market Anomalies Attenuated in the Recent Era of High Liquidity and Trading Activity?” who found that as trading had become cheaper and easier, the average excess return of 12 anomalies or factors had approximately halved. They provided evidence that “hedge fund assets under management, short interest, and aggregate share turnover have led to the decline in anomaly-based trading strategy profits in recent years.”
The publication of research findings and the reduced trading costs have impacted factor premiums. The most significant impact has been on the factors with behavioral explanations because, at least in theory, behavioral anomalies can be arbitraged away (though limits to arbitrage may prevent that from entirely occurring). Even in factors with risk-based premiums (which cannot be arbitraged away), premiums can shrink as cash flows seek to capture them, and the valuation spread between the long and the short side of the factor narrows.
New Research
Jihong Song, author of the January 2023 study “Smart-Beta Institutional Ownership and Stock Return Anomalies,” examined the institutional demand for seven prominent stock return anomalies:
- Profitability: Gross profitability premium, quarterly return on assets, cash-based operating profitability.
- Investment: Asset growth, investment, investment growth.
- Momentum: Six-month momentum, 12-month momentum.
- Earnings Quality: Net operating assets, accruals, percent operating accruals.
- External Financing: One-year net stock issues, composite equity and debt issuance.
- Distress: O-Score, failure probability.
- Earnings Surprise: Standardized unexpected earnings, analyst forecast revision, announcement return for previous earnings.
Song used a three-step procedure to construct a cross-sectional rank score for each anomaly. First, for each anomaly, he selected two to three stock characteristics frequently used to represent the anomaly. Second, he transformed all characteristics into cross-sectional rank scores from 0 to 1, with a higher rank representing a higher expected return as predicted by the characteristic. Third, for each of the seven anomalies, he averaged the rank scores of the two to three stock characteristics associated with the anomaly and transformed this average into cross-sectional rank scores. For each anomaly, a higher score meant that the stock should have a higher expected return based on that anomaly.
The table below shows the factor premiums and a composite anomaly score (which Song used in much of his analysis) over the sample period 1980-June 2021:
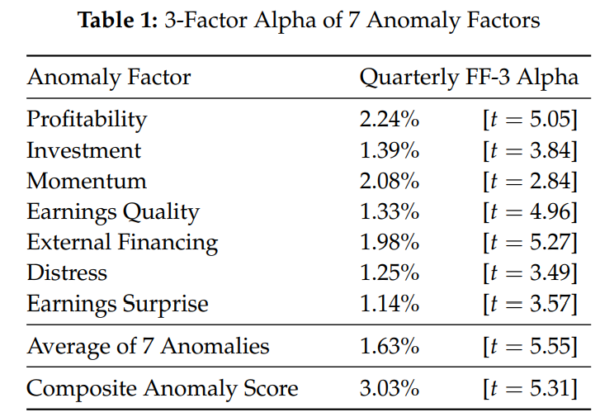
The results are hypothetical results and are NOT an indicator of future results and do NOT represent returns that any investor actually attained. Indexes are unmanaged and do not reflect management or trading fees, and one cannot invest directly in an index.
Song defined smart beta investors as those with high demand for the factor—they are investors “who trade against uninformed or non-pecuniary demand from other investors.” His data sample covered the period 1980-June 2021 and stocks that traded on the NYSE, AMEX, and Nasdaq that had positive book equity. To make sure microcaps did not drive his results, he only used stocks with market capitalization greater than the 10th NYSE percentile. Song found:
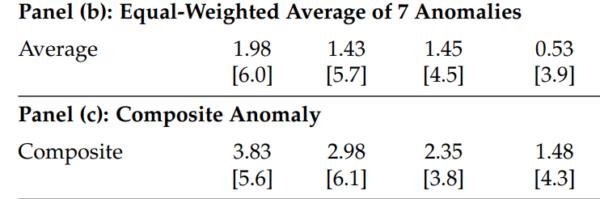
- Among stocks with low factor-specific smart-beta institutional ownership (SBIO), the seven anomalies generated 1.98% of quarterly three-factor (market, size, and value) alpha on average. Among stocks with high factor-specific SBIO, they generated 1.45% of quarterly three-factor alpha on average. The difference between low- and high-SBIO portfolios was 0.53 percentage point (t-stat = 3.9) and was economically significant compared to the average quarterly alpha of 1.63% for the seven anomalies (see Table 1 above).
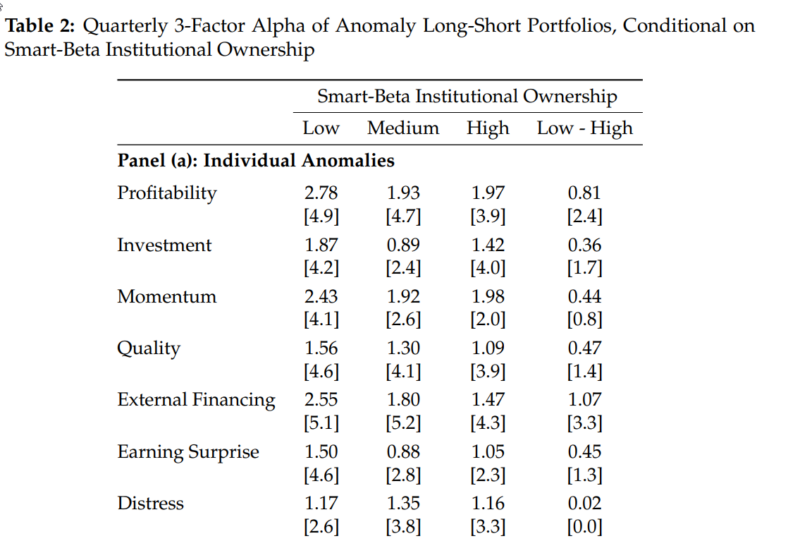
The results are hypothetical results and are NOT an indicator of future results and do NOT represent returns that any investor actually attained. Indexes are unmanaged and do not reflect management or trading fees, and one cannot invest directly in an index.
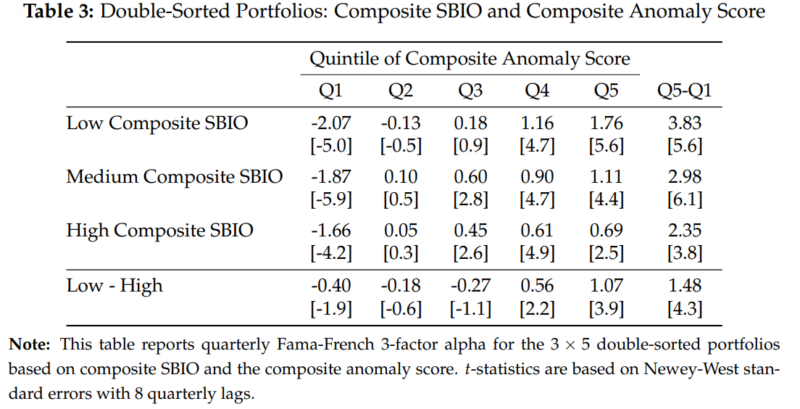
- The short leg of the composite anomaly portfolio (lowest quintile by composite anomaly score) generated an alpha of -2.07% among low-SBIO stocks and -1.66% among high-SBIO stocks (difference of 0.41 percentage point). On the other hand, the long leg of the composite anomaly portfolio generated an alpha of 1.76% among low-SBIO stocks and 0.69% among high-SBIO stocks (difference of 1.07 percentage points)—the higher alpha of the composite anomaly factor among low-SBIO stocks was primarily driven by the “underpriced” stocks in the long leg, and only partly by the “overpriced” stocks in the short leg. This suggests that the relationship between SBIO and anomaly return is not driven by short-sale constraints.
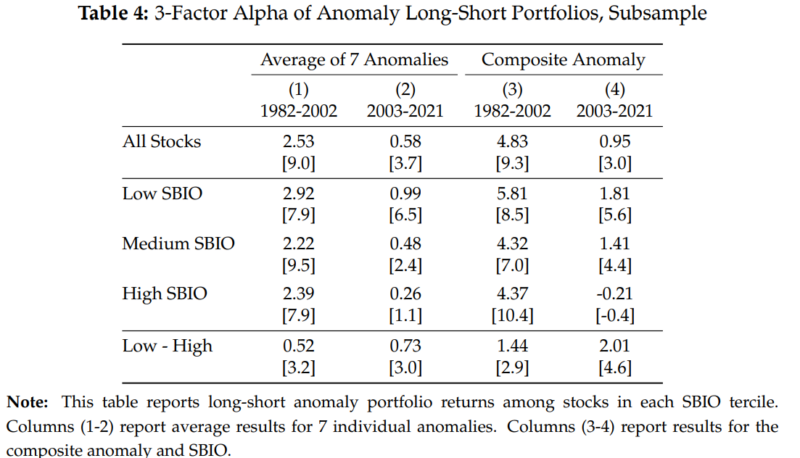
- The average quarterly alpha of the composite anomaly was 4.83% from 1982 to 2002 but only 0.95% from 2003 to 2021. In addition, from 2003 to 2021, the anomalies only generated significant alpha among stocks with low or medium SBIO—the incredibly shrinking alpha.
- The return predictability of seven anomalies on average decreased by 13.5% per one-standard-deviation higher smart-beta institutional ownership—the relationship was particularly salient in the recent sample period from 2003 to 2021.
- A quintile long-short portfolio that exploited the average of the seven anomalies generated a significant quarterly alpha of 1.81% among stocks in the lowest tercile of smart-beta institutional ownership. In contrast, a similar strategy only earned a statistically insignificant return of -0.21% among stocks in the highest tercile of smart-beta institutional ownership.
- The difference between anomaly alpha in low- and high-SBIO stocks was larger in magnitude after excluding the smallest and most illiquid stocks—the results were not driven by the smallest, most illiquid stocks.
- Smart-beta investors were less willing to hold stocks with higher idiosyncratic risk (IVOL)—after controlling for other basic stock characteristics, a one-standard-deviation higher idiosyncratic volatility was associated with a -0.08-standard-deviation lower composite smart-beta institutional ownership. (Among the many anomalies in finance is that idiosyncratic volatility is associated with lower returns. Thus, smart beta investors should be expected to avoid stocks with high IVOL.)
- Smart-beta investors were more willing to hold stocks tracked by more popular benchmarks, perhaps because they are subject to benchmarking themselves—cross-sectional anomalies were weaker among stocks with higher benchmarking demand because those stocks have more smart-beta institutional owners.
- Consistent with smart-beta investors trading according to value and low-beta factors, the composite SBIO was higher among value stocks (low market-to-book) or stocks with low market beta.
- The relationship between composite SBIO and return predictability was still large and statistically significant at a one-year horizon.
- AQR and Dimensional had stronger demand than Vanguard for seven anomaly factors on average—consistent with the well-known investment styles of AQR and Dimensional that focus on factor investing.
Investor Takeaways
Song’s findings provide further evidence that with research publication, the seven anomalies analyzed have been negatively impacted (reduced premiums) by smart-beta investors. The result is that markets are becoming more and more efficient. As they do so, the hurdles to active managers generating alpha increase. As shown in Table 4 above, even in the case of the seven anomalies Song examined using either the average score or Song’s composite score, there remained statistically significant premiums. For anomalies that are risk-based, that is what we should expect to see because, while risk cannot be arbitraged away, cash flows can reduce the size of the premium. For the anomalies that are behavioral based, it appears that limits to arbitrage are still sufficient to allow them to persist post-publication.
Larry Swedroe is head of financial and economic research for Buckingham Wealth Partners.
For informational and educational purposes only and should not be construed as specific investment, accounting, legal, or tax advice. Certain information is based on third-party data and may become outdated or otherwise superseded without notice. Third-party information is deemed reliable, but its accuracy and completeness cannot be guaranteed. By clicking on any of the links above, you acknowledge that they are solely for your convenience and do not necessarily imply any affiliations, sponsorships, endorsements, or representations whatsoever by us regarding third-party websites. We are not responsible for the content, availability or privacy policies of these sites, and shall not be responsible or liable for any information, opinions, advice, products or services available on or through them. The opinions expressed by featured authors are their own and may not accurately reflect those of Buckingham Strategic Wealth® or Buckingham Strategic Partners®, collectively Buckingham Wealth Partners. Neither the Securities and Exchange Commission (SEC) nor any other federal or state agency have approved, determined the accuracy, or confirmed the adequacy of this article. LSR-22-457

About the Author: Larry Swedroe
—
Important Disclosures
For informational and educational purposes only and should not be construed as specific investment, accounting, legal, or tax advice. Certain information is deemed to be reliable, but its accuracy and completeness cannot be guaranteed. Third party information may become outdated or otherwise superseded without notice. Neither the Securities and Exchange Commission (SEC) nor any other federal or state agency has approved, determined the accuracy, or confirmed the adequacy of this article.
The views and opinions expressed herein are those of the author and do not necessarily reflect the views of Alpha Architect, its affiliates or its employees. Our full disclosures are available here. Definitions of common statistics used in our analysis are available here (towards the bottom).
Join thousands of other readers and subscribe to our blog.