The empirical research on the ability of actively managed funds, including such studies as the 2002 paper “Mutual Fund Performance: An Empirical Decomposition into Stock-Picking Talent, Style, Transactions Costs, and Expenses” by Russ Wermers, has found that they do have the ability to identify stocks that go on to outperform appropriate benchmarks—they are skilled. But are active managers victims of the same bias as individual investors? That is the question we’ll explore in this paper.
Gross Alpha – A Zero Sum Game
Unfortunately, that same empirical research has found that the gross alpha (risk-adjusted outperformance) generated has not been sufficient to offset active managers’ implementation costs, which include not only the fund’s expense ratio but its trading costs and the drag from holding cash—their net alphas (the only kind investors care about) are negative. Of course, since generating even gross alpha is a zero-sum game (generating net alpha is a negative-sum game due to costs), there must be losers. And the losers, as a series of studies by Brad Barber and Terrance Odean have demonstrated (for example, here), have been retail investors—the stocks they buy go on to underperform, and the stocks they sell go on to outperform.
New Research
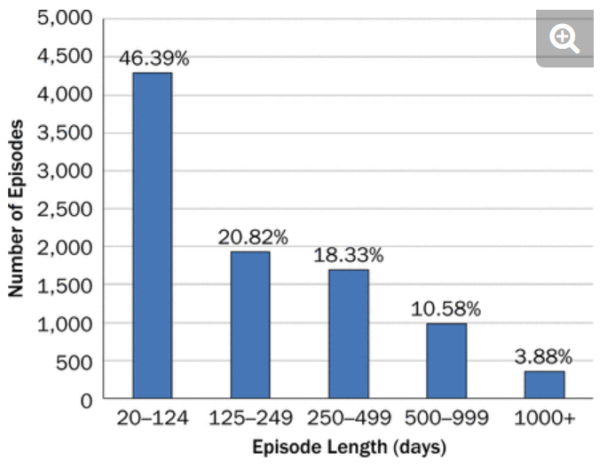
There’s an interesting new paper on the subject of active managers and their ability to generate alpha by Chris Woodcock, Alesi Rowland and Snežana Pejić, “The Alpha Life Cycle: New Insight into Investment Alpha and How Portfolio Managers Can Sustain It,” published in the October 2022 issue of The Journal of Investing. Excluding positions held for less than 20 days, they examined 9,254 episodes (full cycles of a given position from first entry to last exit) across 43 active equity portfolios of Essentia Analytics over 2005-2019. Following is a summary of their findings: The vast majority of episodes (85.54 percent) were less than 500 business days long, and the average entry-to-exit episode was just under a year (257 business days).
Frequency of Different Episode Lengths within the Data Set
- Excess return attributable to manager decision-making at the position level (e.g., timing, sizing, scaling) has a distinct and persistent life cycle, tending to accumulate in the early phase of an investment and decay over time—often precipitously.
- The average episode’s alpha trajectory (as measured by cumulative excess return on investment, or ROI, over the nominated index of the portfolio) followed an inverted horseshoe pattern and finished with a loss of over 2 percent—on average, positions were held too long.
Grand Mean of Cumulative Relative ROI Over All Episodes
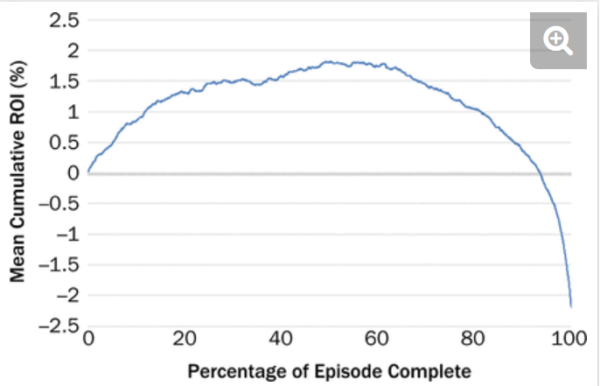
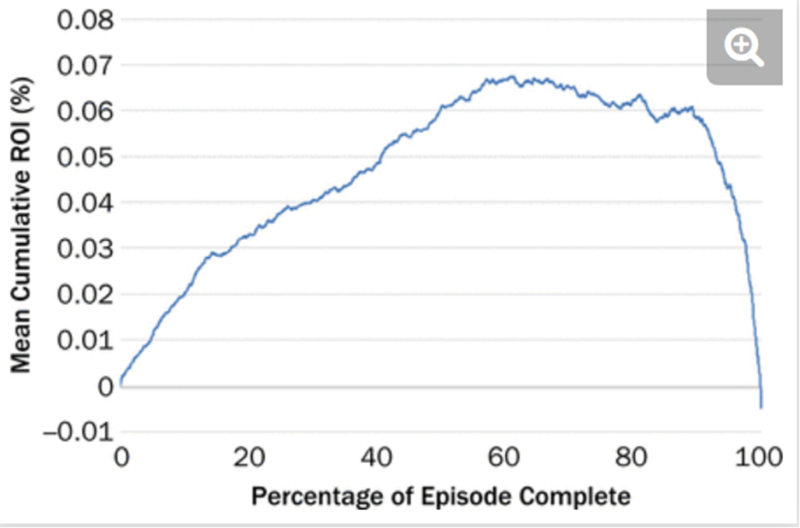
- There was a progressive rise in cumulative return on investment (the curve is in its top quartile for about six months and above 50 percent for about nine months) followed by a steep decline before exit, with the mean overall impact of each full episode marginally negative; the drop from the peak to exit was 7.22 basis points.
Grand Mean Cumulative ROI for All Episodes Relative to the Percentage Through Episode
Citing research from the field of behavioral finance, Woodcock, Rowland and Pejić hypothesized that holding positions too long could be explained by the well-documented bias of the endowment effect—the tendency to place greater value on something already owned, often considered as a manifestation of loss aversion, a component predicted by prospect theory. They explained that once an investor holds an appreciating stock, “the investor imbues that stock with positive attributes. Once the stock appreciation begins to deteriorate or plateau and the investor is considering a sell, a higher value is given to longstanding positive views of the stock, leading the investor to hold the security while sacrificing previous positive contributions to alpha.”
Their hypothesis is consistent with the findings of Mengqiao Du, Alexandra Niessen-Ruenzi, and Terrance Odean, authors of the 2018 study “Stock Repurchasing Bias of Mutual Funds,” and Mehran Azimi, author of the 2019 study “Are Professional Investors Prone to Behavioral Biases? Evidence from Mutual Fund Managers,” who found that professional investors suffer from behavioral biases (such as overconfidence, political bias and home country bias), that their market outlook affects their risk-taking and asset allocation, and that fund managers’ optimism is detrimental to fund investors.
Conclusion: Are active managers biased the same way as individual investors?
The first takeaway should be that active investors appear to be subject to the same biases, including the endowment effect, as are individual investors—biases that negatively impact their performance. Systematic funds (such as, but not limited to, index funds) have the advantage of not having any human biases that can negatively impact their performance.
While the evidence we reviewed showed that while the active funds held their positions too long, cutting their holding period would lead to increased costs due to higher turnover. That higher turnover could be a significant negative in smaller stocks, with their higher bid-offer spreads, and greater market impact costs in addition to decreasing tax efficiency for taxable investors—potentially the incremental costs could exceed any benefits.
Disclaimers
For informational and educational purposes only and should not be construed as specific investment, accounting, legal, or tax advice. Certain information is based upon third party data and may become outdated or otherwise superseded without notice. Third party information is deemed to be reliable, but its accuracy and completeness cannot be guaranteed. By clicking on any of the links above, you acknowledge that they are solely for your convenience, and do not necessarily imply any affiliations, sponsorships, endorsements, or representations whatsoever by us regarding third-party websites. We are not responsible for the content, availability, or privacy policies of these sites, and shall not be responsible or liable for any information, opinions, advice, products, or services available on or through them. Neither the Securities and Exchange Commission (SEC) nor any other federal or state agency have approved, determined the accuracy, or confirmed adequacy of this article. The opinions expressed here are their own and may not accurately reflect those of Buckingham Strategic Wealth® or Buckingham Strategic Partners®, collectively Buckingham Wealth Partners. LSR-22-401

About the Author: Larry Swedroe
—
Important Disclosures
For informational and educational purposes only and should not be construed as specific investment, accounting, legal, or tax advice. Certain information is deemed to be reliable, but its accuracy and completeness cannot be guaranteed. Third party information may become outdated or otherwise superseded without notice. Neither the Securities and Exchange Commission (SEC) nor any other federal or state agency has approved, determined the accuracy, or confirmed the adequacy of this article.
The views and opinions expressed herein are those of the author and do not necessarily reflect the views of Alpha Architect, its affiliates or its employees. Our full disclosures are available here. Definitions of common statistics used in our analysis are available here (towards the bottom).
Join thousands of other readers and subscribe to our blog.