Here’s our latest strategic update given recent changes for Q4 and beyond. To learn more about our investment management service please contact us here.
Macroeconomic Overview
Our macroeconomic forecast for 2023 called for a year of disinflation and “muddle through”. That means we expected the economy to remain sluggish and for inflation to show positive rates of change that were sequentially slower. Real GDP has averaged 2.3% and inflation peaked back in 2022 almost exactly to the month we predicted. But the story has been more complex than that because the rate of inflation has remained higher than the Fed is comfortable with and the economy has shown more resilience than most expected (most economists expected outright recession in 2023). That said, we don’t see the story changing all the much from here on out. The economy is still digesting the excesses of the Covid boom and that process is not over yet. It could last several more years. And that means that disinflation and sluggish growth are likely to remain dominant themes.
Environments like this are characterized by unusually high risks primarily because you’re coming off a period of excess that the Federal Reserve is aggressively trying to counteract. This not only creates unusual risk of a slowdown, but it creates the risk of a credit event that slows the economy even more than expected. We’ve seen some signs of credit buckling earlier this year with the bank panic, but so far it’s remained mostly under control. The financial markets are especially jittery during periods like this because there is so much uncertainty about the future impact of policy and economic activity.
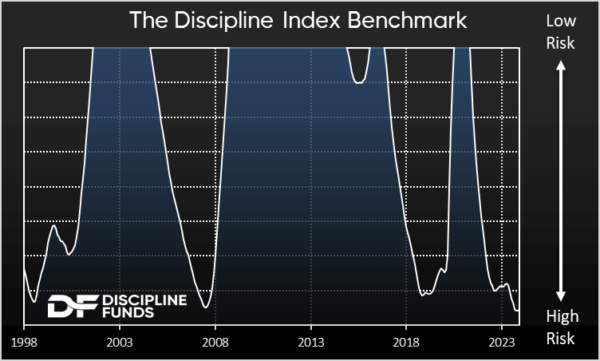
This is best seen in the Discipline Index Benchmark which shows the level of risk in the financial markets over time. When the Index is at or near current levels the S&P 500 averages annual 3 year returns of 6.2% with a standard deviation of 22.6. That compares to the historical returns of 11.5% per year with a standard deviation of 19.6. In other words, environments like the current one are periods where the financial markets earn lower average returns with higher average risk, which is what we’ve seen over the last 2 years since the index moved sharply lower.
Asset Allocation
The Discipline Index is our core benchmark index and has an average duration, as measured in the Defined Duration strategy, of 10 years. It’s a long only stock/bond index that seeks to generate growth, but will never be as low risk as a bond index or as risky as an all stock index. It is a relatively moderate risk instrument in terms of its time horizon at 10 years. The index has been conservatively positioned for the last 2 years and recently shifted to a weighting of 32% stocks and 68% bonds. We benchmark to global cap weighting in the stock component, but one interesting change in recent quarters was that the index actually shifted to an overweight value position to offset the unusual expansion in growth stocks, mostly coming from the handful of US stocks that have driven the S&P 500 this year. This created an unusual distortion in the weighting of US tech stocks so our global market cap target resulted in adding more value to the portfolio. As a result of this we’re now overweight value in our stock holdings and more cautious about growth and US tech in particular.
On the fixed income side the credit monitors remain very conservative. The portfolio has no corporate credit risk at the moment and is consistent with an environment in which credit tightens as a result of slowing economic growth and aggressive Fed tightening. We hope that changes in the coming quarters as corporate credit starts to look increasingly enticing with prices having fallen so much in the last 2 years. That said, the portfolio is all US government bonds at the moment because of the unusual asymmetric risk that Fed tightening cycles create for corporations.
In terms of duration we came into Q2 with an average duration of 5 years. But the recent surge in interest rates resulted in a shift to a slightly longer duration profile of 7 years. It’s interesting running an algorithmic asset allocation in periods like this where every fiber of your body says that owning longer duration bonds is bad, but the system forces you to buy that uncomfortable dip. This is, of course, exactly what we should be doing. When bond prices go down and yields go up the expected future risk adjusted returns of the instrument should rise. Owning a 10 year Treasury Note at 5% is vastly superior to owning the same instrument in 2020 at a yield of 2%, but with that instrument in the middle of a 20%+ decline it’s not exactly easy to buy without wondering if it will keep going down in the short-term. Of course, we’d tell you to be a little more patient and think of the instrument for what it is – a 10 year instrument. That is, after all, the main goal of our Defined Duration approach. We want to give investors greater clarity of their financial goals and the way their financial assets match those specific time horizons so they can navigate the financial markets more patiently and more rationally. Our industry does a terrible job of communicating time horizons to investors and time is the main thing we all care about. I am hopeful that the Defined Duration strategy will make a meaningful step in helping investors better understand how time relates to their financial goals and asset allocation so they can invest more confidently.
Overall, I’d summarize this environment as a period of continued digestion of the Covid boom where unusual risks remain. It’s not a reason to panic and run for the hills, but some risk management and patience is typically a smart way to help you navigate these sorts of challenging environments.
We’ll be out with a new 2024 forecast in the coming month so stay tuned. In the meantime, I hope the rest of 2023 treats you well.