Market efficiency, higher trading costs and higher expense ratios are not the only hurdles to successful active management (market timing and individual security selection). For taxable investors, the burden of higher taxes raises the hurdle.(1) From 2002 until now, S&P Dow Jones Indices has published its S&P Indices Versus Active (SPIVA) Scorecard, comparing the performance of actively managed mutual funds to their appropriate index benchmarks, without considering the impact of taxes. Even without that incremental burden, the U.S. Mid-Year 2023 Scorecard showed that over the long term, active managers failed with great persistence in every single equity asset class. For example, over the prior 20 years:
- 93% of funds underperformed the benchmark S&P Composite 1500.
- 94% of large-cap funds underperformed the benchmark S&P 500.
- 94% of small-cap funds underperformed the benchmark S&P SmallCap 600.
- 95% of mid-cap funds underperformed the benchmark S&P MidCap 400.
- 94% of multi-cap funds underperformed the benchmark S&P Composite 1500.
Similar results were found for growth and value funds of various capitalization categories.
On a risk-adjusted basis (annualized standard deviation of monthly returns divided by annualized volatility), the results were even worse: 97% of all funds underperformed the benchmark S&P Composite 1500. Similar results were found in the various individual categories. Finally, the average underperformance was quite large, even before considering taxes, which are typically the greatest expense for active funds held in taxable accounts. For example, over the 20 years, the average asset-weighted (equal-weighted) underperformance of domestic equity funds versus the S&P Composite 1500 was 1.21% (1.82%).
In November 2023 SPIVA provided their first After-Tax Scorecard, reporting results for actively managed large-cap funds over the prior 20 years. After-tax fund performance was calculated on a pre-liquidation basis using the highest historically applicable individual federal marginal income and capital gains tax rates in place at each point in time. They relied on a convention established in 2001 when the Securities and Exchange Commission (SEC) introduced rules requiring fund managers to annually report after-tax performance using a standardized treatment for dividends, capital gains, and other fund distributions. They applied this methodology by multiplying the taxable distributions issued by actively managed U.S. equity mutual funds by 1 – t (where t equals the relevant tax rate applicable to the distribution type at the date of distribution) before calculating performance assuming immediate reinvestment of the remaining amounts. To make “apples to apples” comparisons, they applied an equivalent calculation to generate a hypothetical after-tax performance for each comparison benchmark. After-tax index performance was calculated using historically applicable qualified dividend tax rates applied to historical index dividends on a daily basis, assuming immediate reinvestment of the remaining amounts. State and local tax liabilities, alternative minimum tax, or phaseouts of certain tax credits, exemptions, and other deductions were excluded. Following is a summary of their key findings:
- After taxes, the median active fund trailed the S&P 500 over every time horizon (1, 3, 5, 10, and 20 years) by up to 3.5% annually.
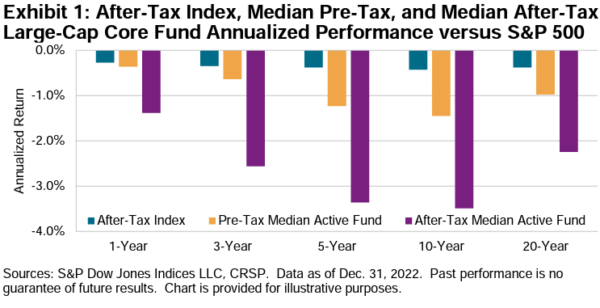
The results are hypothetical results and are NOT an indicator of future results and do NOT represent returns that any investor actually attained. Indexes are unmanaged and do not reflect management or trading fees, and one cannot invest directly in an index.
- Over the 20-year horizon, while 92% of all domestic funds underperformed their benchmarks on a pretax basis, 97% failed on an after-tax basis. Similarly, while 95% of large-cap funds failed on a pretax basis, 98% failed on an after-tax basis. For large-cap core funds, the figures were similar, 96% and 98%, respectively.
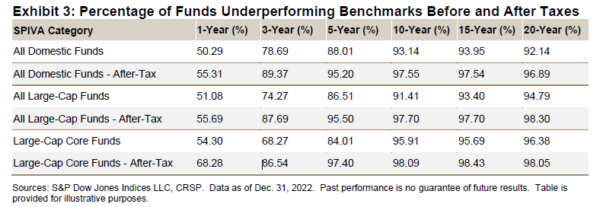
The results are hypothetical results and are NOT an indicator of future results and do NOT represent returns that any investor actually attained. Indexes are unmanaged and do not reflect management or trading fees, and one cannot invest directly in an index.
- On an equal-weighted basis, while the average domestic fund underperformed the S&P 1500 Composite Index by 1% on a pretax basis, the underperformance increased to 1.93% on an after-tax basis.
The report highlighted the fact that the timing of some capital gains distributions illustrated a particularly gloomy possibility for taxable investors:
“Over the past 20 years, the combination of falling markets and fund redemptions, often closely related, has more than once forced active managers to realize gains and trigger tax bills for investors in years when fund owners were already reeling from performance declines.”
As the chart below illustrates, a relatively high proportion of capital gains have been distributed in years when the overall market declined.
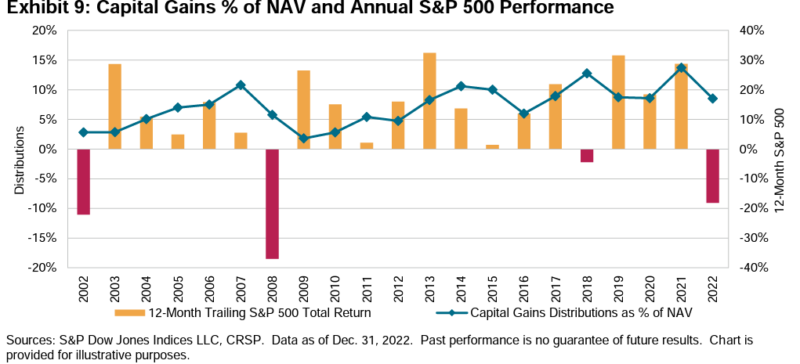
The results are hypothetical results and are NOT an indicator of future results and do NOT represent returns that any investor actually attained. Indexes are unmanaged and do not reflect management or trading fees, and one cannot invest directly in an index.
Their findings led S&P to conclude:
“Even for an investor who can identify those few managers with market-beating potential, to participate in that outperformance, they must also hope that their eventual performance is not unduly diminished by taxes. The results of this scorecard highlight that, at least in broad U.S. equities, and at least over the last 20 years, taxes would have made a considerable impact on the average returns of actively managed funds, and that the task of selecting an active fund that outperformed after tax was almost (if not completely) impossible.”
The results are unsurprising to those who are aware of the findings from academic researchers. For those unaware, here’s a review of the literature.
The evidence
Robert Jeffrey and Robert Arnott, authors of the 1993 study, “Is Your Alpha Big Enough to Cover Its Taxes,” found that during the 10-year period they studied, 21% of actively managed funds beat passive alternatives on a pretax basis, just 7% did so on an after-tax basis. They concluded:
“The preponderance of evidence is so convincing we conclude that the typical approach of managing taxable portfolios as if they were tax-exempt is inherently irresponsible, even though doing so is the industry standard.”
In 2000, Arnott, along with co-authors Andrew Berkin and Jia Ye, followed up with the study, “How Well Have Taxable Investors Been Served in the 1980s and 1990s?” The authors investigated the pretax and after-tax efficiency of actively managed funds, the likelihood of pretax and after-tax outperformance, and the relative size of outperformance versus the relative size of underperformance. The following is a summary of their findings:
- The average fund underperformed its benchmark by 1.75% per year before taxes and by 2.58% on an after-tax basis.
- Just 22% of funds managed to beat their benchmarks on a pretax basis. The average outperformance was 1.4%; the average underperformance was 2.6%. But on an after-tax basis, only 14% of funds outperformed. The average after-tax outperformance was 1.3%, while the average after-tax underperformance was 3.2%. The risk-adjusted odds against outperformance were about 17:1.
In their 2011 study, “Is Your Alpha Big Enough to Cover Its Taxes? Revisited,” Arnott and Berkin, along with Paul Bouchey, updated the 1993 paper. They concluded that the typical approach for managing taxable portfolios, acting as if taxes cannot be reduced or deferred, remained the industry standard. Yet they estimated that the typical active fund needed to generate a pretax alpha of more than 2% per year to offset the tax drag from their active strategies — and most could not accomplish that feat. The finding of a tax drag over 2% was consistent with the findings from other studies. The following table is from Arnott, Berkin, and Bouchey’s paper.
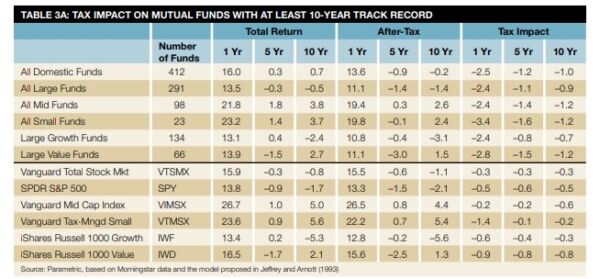
The results are hypothetical results and are NOT an indicator of future results and do NOT represent returns that any investor actually attained. Indexes are unmanaged and do not reflect management or trading fees, and one cannot invest directly in an index.
Jeffrey Ptak of Morningstar compared the after-tax returns of domestic actively managed mutual funds with after-tax returns of comparable Vanguard index funds. His study, which included more than 4,500 funds, covered the 10 years ending October 2015. The methodology Morningstar used for determining after-tax returns followed SEC guidelines, which are based on these assumptions: The investor sells the holding at the end of the period and pays capital gains taxes on any appreciation in price; distributions are taxed at the highest prevailing federal tax rate and then reinvested; state and local taxes are excluded; only the capital gains are adjusted for tax-exempt funds because the income from these funds is nontaxable; and the total return is adjusted for the effects of sales loads. A summary of Ptak’s results is shown in the table below:
| Asset Class | Percentage of Actively Managed Funds That Outperformed(%) | Average Performance Versus Vanguard Index Fund (%) | Average Annualized Underperformance of the Losers (%) | Average Annualized Outperformance of the Winners (%) |
| Large Blend | 4.8 | -0.96 | -1.17 | 0.76 |
| Large Growth | 8.7 | -1.01 | -1.61 | 0.95 |
| Large Value | 11.0 | -0.67 | -1.16 | 0.72 |
| Mid Blend | 4.8 | -1.49 | -1.71 | 0.56 |
| Small Blend | 5.4 | -1.45 | -1.70 | 0.65 |
| Small Growth | 7.8 | -1.23 | -1.69 | 0.87 |
| Small Value | 10.2 | -0.93 | -1.37 | 0.90 |
The success rate calculations in the table don’t contain any survivorship bias (the study assumed any fund that started the period but did not finish the period was a failure), but the average returns were survivorship biased (there was no 10-year post-tax return to the average for the obsolete funds). Thus, the average returns as well as the returns of the losers were likely overstated (i.e., worse than shown).
In not a single case were even 11% of actively managed funds able to outperform their Vanguard index fund benchmark on an after-tax basis. What’s more, the average underperformance ranged from -0.67% to -1.45% (because of survivorship bias, the true level of underperformance was likely even worse).
In each case only a small minority of active funds outperformed, and the margin of outperformance earned by these very few winners was much smaller than the margin of underperformance posted by the much larger number of losers. In other words, the odds of outperforming were not only poor, but when funds did outperform, the margin of outperformance tended to be small (from 0.56% to 0.95%). When a fund lost, the margin of underperformance was much greater (from -1.16% to as much as ‑1.71%).
Using the large blend category as an example, we can calculate the risk-adjusted odds of outperformance. With the 95.2% of active funds that underperformed doing so by an average of -1.17% and the 4.8% of active funds that outperformed doing so by an average of 0.76%, the risk-adjusted odds of outperformance were 31:1.
The risk-adjusted odds of outperformance for the other categories were: large growth, 18:1; large value, 13:1; mid blend, 61:1; small blend, 46:1; small growth, 23:1; and small value, 13:1. The average risk-adjusted odds of outperformance when equal-weighting all seven categories were 29:1. Again, because of survivorship bias, the risk-adjusted odds of outperformance were worse than those already abysmal figures suggest.
Because of the two major bear markets we experienced in the first decade of this century, the impact of taxes on returns over the period that Ptak examined was likely to have been less than the long-term experience.
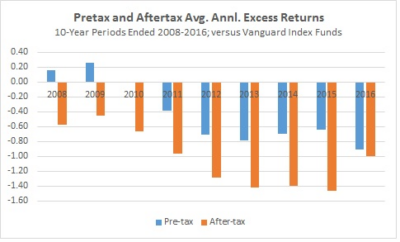
Ptak took another look at this issue in his November 2016 article, “Investing Taxable Money in Active Stock Funds? Bad Idea.” The following figure, which is from that article, shows the pretax and after-tax average annual excess returns of active funds relative to Vanguard’s index funds over 10-year periods ending 2008 through 2016.
The results are hypothetical results and are NOT an indicator of future results and do NOT represent returns that any investor actually attained. Indexes are unmanaged and do not reflect management or trading fees, and one cannot invest directly in an index.
As shown, while active equity funds lagged a comparable Vanguard index fund by about 50-100 basis points per year pretax, that shortfall widened to 1% or more after taxes. And that is even before considering survivorship bias in the data.
To address the tax-drag problem, some active fund families have developed funds that focus on tax management. Dale Domian, Philip Gibson, and David Nanigian, authors of the study, “Is Your Tax-Managed Fund Manager Hiding in the Closet?,” which appeared in the Fall 2015 issue of the Journal of Wealth Management, examined the performance, expense, and tax efficiency of domestic equity mutual funds that had a stated goal of minimizing the taxes paid by their shareholders. Their study used the Morningstar database (which includes about 2,000 U.S. equity funds) covering the period 2010 through 2014, and the Carhart four-factor (market beta, size, value, and momentum) model, to compare the returns of tax-managed funds with the returns of actively managed funds that were not tax-managed, and index funds and ETFs. The following is a summary of their main findings:
Consistent with a large body of evidence, on average over 95% of the variability in the returns on these funds was explained by the four common factors in stock returns.
- When compared to their inherently tax-advantaged passively managed counterparts, the tax-managed funds failed to save their investors more money on taxes than their incremental expenses. The results were statistically significant at the 1% level in four of the five years.
- There was little difference between the expenses of tax-managed funds and those of their actively managed but not tax-managed counterparts.
The authors also found that in their efforts to manage taxes more efficiently, the tax-managed funds became closet indexers — the R-squared figures of the tax-managed funds were higher. The mean value of the R-squared figures of the tax-managed funds ranged from 0.95 to 0.99 in each year, comparable to the R-squared figures of their passively managed and ETF counterparts. This indicates that there was not much effort in security selection. Yet, their expense ratios are much higher, averaging 1.00% to 1.09% a year — indistinguishable from the expense ratios of their non-tax-managed counterparts and much higher than the expenses of passively managed funds. In other words, despite charging much higher fees, the tax-managed funds simply followed the index-tracking strategies of the lower-cost, passively managed funds. Thus, in many cases, the tax-managed funds produced lower tax bills than those of the passively managed funds, but the savings were much less than the difference in operating expenses.
The tax efficiency argument is even less convincing when compared to ETFs, which are generally more tax-efficient than index mutual funds. For example, while the tax alpha between tax-managed funds and ETFs ranged from a savings of 20 basis points to higher costs of 72 basis points, the extra costs ranged from 67 basis points to 73 basis points. The authors concluded that the practical implication was to avoid actively managed, tax-managed funds because they appeared to be closet indexers and failed to offer meaningful tax savings to investors.
Have active managers learned from the evidence? Rob Arnott, Vitali Kalesnik, and Trevor Schuesler contribute to the literature with their study, “Is Your Alpha Big Enough to Cover Its Taxes? A Quarter- Century Retrospective,” which appeared in the Spring 2018 issue of The Journal of Portfolio Management. (Tommi Johnsen wrote a short summary of this study for Alpha Architect.) The authors noted that the publication of literature on the issue of tax drag had made investors and managers more aware of the issue. They also noted that there were simple techniques to minimize the drag of taxes, including:
- Deferral of realization of capital gains, avoiding intentionally taking short-term gains.
- Loss-harvesting.
- Dividend avoidance, by waiting to purchase a stock that is about to go ex-dividend.
- Yield management, reducing the tax drag created by dividends.
- Lot selection on sale.
Their question was: Are we now seeing different results? The authors used Morningstar’s database, which covered more than 4,000 funds with an average of 10 years of return history per fund. The following is a summary of their findings:
- Disappointingly, active managers still struggled to deliver alpha over their fees and taxes.
- The average actively managed fund that survived the period 1993 through 2017 lost 1.1% of its pretax return (and alpha) to management fees and another 2.4% to taxes, a total of 3.5% in underperformance after taxes.
- “Smart beta” and other passive funds achieved superior tax efficiency by deferring the realization of capital taxes.
- Both fund size and net outflows had some power in predicting the tax burden, as both tended to increase tax obligations.
- Funds with lower turnover and lower dividend yields tended to be more tax-efficient in the future.
The authors concluded: “Tax-sensitive investors are well advised to stay away from active funds that boast frequent trading and claim an ability to capture short- term growth opportunities.” They added: “Historical evidence and common sense suggest that tax-sensitive investors may be better served by avoiding funds touting higher income.” They concluded: “Because most managers pay too much attention to unreliable pretax alpha and too little attention to controllable tax costs, they are destined to fail the investors they serve.”
Investor takeaways
The evidence against the likelihood of active management generating after-tax alpha is so powerful that a June 15, 1998 interview with Barron’s active manager Ted Aronson of AJO Partners had this to say on the subject of taxable investing and active management:
“None of my clients are taxable. Because, once you introduce taxes … active management probably has an insurmountable hurdle. We have been asked to run taxable money — and declined. The costs of our active strategies are high enough without paying Uncle Sam. Capital gains taxes, when combined with transactions costs and fees, make indexing profoundly advantaged, I am sorry to say.”
Interestingly, the 37-year-old firm, which in 2016 had more than $28 billion in assets under management, closed in 2020 after a steep decline in assets under management from investment losses and client redemptions.
Given the evidence, it’s unsurprising that most mutual fund managers focus on pretax returns. But ignoring the impact of taxes on the returns of taxable accounts is one of the biggest mistakes that can be made.
Arnott, Kalesnik and Schuesler observed that one of the great ironies is that some investors and even financial advisors obsess over a difference in management fees as small as a few basis points while often ignoring the less obvious costs of taxes and trading, which can be an order of magnitude larger. While a fund’s expense ratio is an important consideration, focusing solely on lowest cost instead of examining the whole picture (including trading costs, fund construction rules, securities lending revenue, the amount of exposure to factors that have demonstrated persistent premiums, and taxes) is a fool’s errand.
While the ETF structure can help solve some of the tax issues associated with active equity investments (Alpha Architect’s Wes Gray offers his explanation here), the ETF wrapper is not a panacea and can’t solve all the tax problems associated with active investing.
Larry Swedroe is head of financial and economic research for Buckingham Wealth Partners, collectively Buckingham Strategic Wealth, LLC and Buckingham Strategic Partners, LLC.
For informational and educational purposes only and should not be construed as specific investment, accounting, legal, or tax advice. Certain information is deemed to be reliable, but its accuracy and completeness cannot be guaranteed. Third party information is deemed to be reliable, but its accuracy and completeness cannot be guaranteed. Indices are not available for direct investment. Their performance does not reflect the expenses associated with the management of an actual portfolio nor do indices represent results of actual trading. Information from sources deemed reliable, but its accuracy cannot be guaranteed. Performance is historical and does not guarantee future results. All investments involve risk, including loss of principal. Neither the Securities and Exchange Commission (SEC) nor any other federal or state agency has approved, determined the accuracy, or confirmed the adequacy of this article. LSR-23-851

References[+]
| ↑1 | See here for a piece on ETFs and tax efficiency from Research Affiliates |
|---|
About the Author: Larry Swedroe
—
Important Disclosures
For informational and educational purposes only and should not be construed as specific investment, accounting, legal, or tax advice. Certain information is deemed to be reliable, but its accuracy and completeness cannot be guaranteed. Third party information may become outdated or otherwise superseded without notice. Neither the Securities and Exchange Commission (SEC) nor any other federal or state agency has approved, determined the accuracy, or confirmed the adequacy of this article.
The views and opinions expressed herein are those of the author and do not necessarily reflect the views of Alpha Architect, its affiliates or its employees. Our full disclosures are available here. Definitions of common statistics used in our analysis are available here (towards the bottom).
Join thousands of other readers and subscribe to our blog.