As Sam Adams and I explained in our new book, “Your Essential Guide to Sustainable Investing,” while sustainable investing continues to gain in popularity, economic theory suggests that if a large enough proportion of investors choose to favor companies with high sustainability ratings (green businesses) and avoid those with low sustainability ratings (brown or sin businesses), the favored companies’ share prices will be elevated and the excluded shares will be depressed. In equilibrium, the screening out of certain assets based on investors’ preferences/tastes should lead to a return premium on the screened assets.
The result is that the favored companies will have a lower cost of capital because they will trade at a higher price-to-earnings (P/E) ratio. The flip side of a lower cost of capital is a lower expected return to the providers of that capital (shareholders). In conjunction with that idea, sin companies will have a higher cost of capital because they will trade at lower P/E ratios, the flip side of which is a higher expected return to the providers of that capital. The hypothesis is that the higher expected returns(1) are required as compensation for the emotional cost of exposure to offensive companies. On the other hand, investors in companies with higher sustainability ratings are willing to accept the lower returns as the cost of expressing their values. There is also a risk-based hypothesis for the sin premium. It is logical to hypothesize that companies neglecting to manage their environmental, social, and governance (ESG) exposures could be subject to greater risk (2) than their more ESG-focused counterparts. The argument is that companies with high sustainability scores have better risk management and better compliance standards. The stronger controls lead to fewer extreme events such as environmental disasters, fraud, corruption, and litigation (and their negative consequences). The result is a reduction in tail risk in high-scoring firms relative to the lowest-scoring firms. The greater tail risk creates the sin premium.
In addition, sustainable investors sacrifice some of the benefits of diversification relative to a broad-based market index fund because their investments are limited to the universe of stocks that meet a sustainable investing screening process. Intuitively, less diversified portfolios are less efficient ones because exclusions reduce the feasible set of investment portfolios (ESG investors hold less diversified portfolios), worsening the risk/return trade-off.
Our book takes a deep dive into the empirical research findings, reviewing dozens of papers that demonstrate support for both the preferential/taste and risk-based theoretical explanations for the sin premium. The book also goes into great detail about the impact on returns of the dramatic increase in cash flows from sustainable investors. These cash flows create conflicting forces as investor preferences lead to different short- and long-term impacts on asset prices and returns. Firms with high sustainable investing scores earn rising portfolio weights, leading to short-term capital gains for their stocks—realized returns rise temporarily. However, the long-term effect is that higher valuations reduce expected long-term returns. The result can be an increase in green asset returns even though brown assets earn higher expected returns. In other words, there can be an ambiguous relationship between carbon risk and returns in the short term.
New Evidence
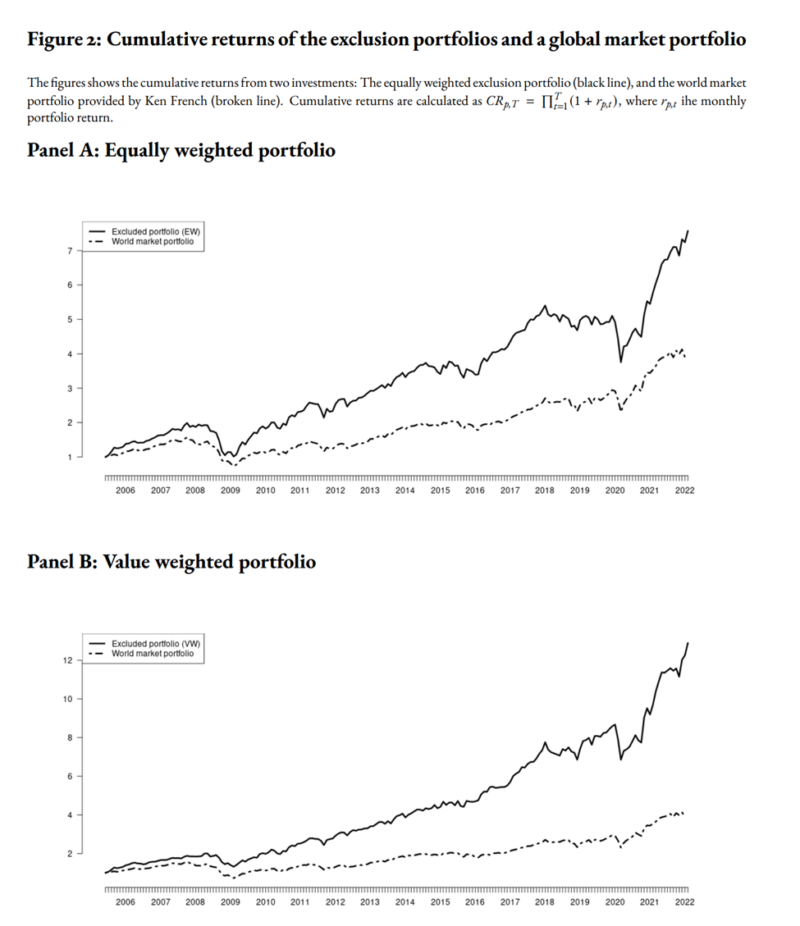
Erika Berle, Wangwei He, and Bernt Ødegaard contribute to the sustainable investing literature with their May 2022 study “The Expected Returns of ESG Excluded Stocks. The Case of Exclusions from Norway’s Oil Fund” in which they analyzed the consequences of widespread ESG-based portfolio exclusions on the expected returns of firms subject to exclusion. They used the exclusions of the Norwegian Government Pension Fund Global (GPFG), the world’s largest sovereign wealth fund—with an equity portfolio valued at $1 trillion at the end of 2021—whose ESG decisions are used as a model for many institutional investors.
The ethical guidelines used for exclusions are determined by Norway’s Ministry of Finance and contain both product-based exclusions (currently including tobacco, cannabis, certain types of weapons, and coal) and conduct-based exclusions (currently including human rights abuses, environmental damage, unacceptable levels of greenhouse gas emissions, corruption, and sale of weapons to specific states). Berle, He, and Ødegaard constructed various portfolios representing the GPFG exclusions—portfolios were constructed for all excluded stocks and the reasons for exclusion. They measured performance as alpha relative to the global five-factor model of Fama and French. Their data sample covered the period 2005-2022, with a total of 189 companies having been excluded for various periods.
Following is a summary of their findings:
- Exclusion portfolios (low ESG-scoring firms) had significantly superior performance (alpha) relative to a Fama-French five-factor model. For example, the equally weighted portfolio of all excluded stocks had a statistically significant annual alpha of almost 5%. The U.S. part of the exclusion portfolio had an even higher 5.7% alpha. The value-weighted alphas were even higher, at almost 7%, for the global portfolio. Alphas were significant at the 1% confidence level.
- Using equal weighting, the excluded portfolio had exposure to the size and value factors, while the value-weighted excluded portfolio had negative exposure to the size factor but positive exposure to the value factor.
- The exclusion portfolio had lower systematic risk than the market—market beta was below 1.
- The alphas of the conduct-based portfolios were double those of the alphas for the product-based portfolios.
- The results were robust to alternative factor models, including the one-factor capital asset pricing model (market beta), three-factor (adding size and value), and four-factor (adding momentum) models, subperiods, and other tests.
Their findings led Berle, He and Ødegaard to conclude:
“The sheer magnitude of the excess returns (5% in annual terms) leads us to conclude that short-term price pressure cannot be the only explanation for our results, the excluded firms expected returns must be higher in the longer term.”
They added:
“One way to interpret the results is to think in terms of the equilibrium cost of capital. Firms with such a bad ESG rating that they are excluded from the GPFG may be facing an uphill struggle in raising capital for new investments. They, therefore, have to offer higher returns to the investors willing to ‘dirty their hands’ by providing capital. From society’s point of view, this is a good thing, the higher capital cost will actively discourage investment in low-rated ESG projects, as fewer projects will be able to sustain such high returns. … Thus, when financing new investments, the brown firms will face a steeper hurdle rate than green firms. These brown firms will then have an incentive to become greener to access cheaper capital. In equilibrium, this will be a true tradeoff, and future investments will be greener.”
Investor Takeaways
The empirical evidence clearly demonstrates that exclusions result in ex-ante premiums for the excluded stocks. Berle, He, and Ødegaard found that the slightly less than 200 stocks excluded from the GPFG had produced dramatically superior returns (alpha). Those investors who care only about returns could consider building a “vice” portfolio and then if they desire, donate the higher expected returns directly to causes they care about. Those investors who want to express their values through their investments should keep in mind that excluded stocks make up a very small fraction of all stocks and a small percentage of the total market capitalization, which means that excluding stocks doesn’t reduce portfolio returns by the roughly 5% found by Berle, He and Ødegaard. For example, a 2017 study found that exclusions had reduced the return to the Norway Fund by 1.1% over the prior 11 years.
Investors should also consider that empirical research has found that the excess returns to the excluded stocks are accompanied by greater risks for these companies. As discussed in “Your Essential Guide to Sustainable Investing,” low-scoring ESG stocks have greater risks, including potential legislation leading to stranded assets, potential consumer boycotts, frauds due to poor risk controls, poor governance, human rights scandals, and environmental scandals. The result is that they have less crash risk. In other words, those higher returns are not free lunches but are, at least partially, in compensation for greater risks
Finally, investors should note that since 2018, when cash flows into sustainability strategies dramatically increased, there have been conflicting forces at work that have resulted in green stocks outperforming the higher expected returns of brown stocks.
Conflicting Forces
Given the trend to sustainable investing, firms with high sustainability scores are earning rising portfolio weights, leading to short-term capital gains for their stocks—realized returns rise temporarily. Thus, the result can be an increase in green asset returns even though brown assets earn higher expected returns. For example, the authors of the 2022 study “Dynamic ESG Equilibrium” found that despite investor preferences for sustainable investments creating a brown premium of about 1 percent per year, over the period 2018-2020 the increased demand for sustainable investments led to a green portfolio outperforming by about 7 percentage points a year (14 percent versus 7 percent). However, the long-term effect is that the higher valuations reduce expected long-term returns.
Important Disclosures
For informational and educational purposes only and should not be construed as specific investment, accounting, legal, or tax advice. Certain information is deemed to be relaible, but its accuracy and completeness cannot be guaranteed. Third party information may become outdated or otherwise superseded without notice. By clicking on any of the links above, you acknowledge that they are solely for your convenience, and do not necessarily imply any affiliations, sponsorships, endorsements or representations whatsoever by us regarding third-party websites. We are not responsible for the content, availability or privacy policies of these sites, and shall not be responsible or liable for any information, opinions, advice, products or services available on or through them. The opinions expressed by featured authors are their own and may not accurately reflect those of Buckingham Strategic Wealth® or Buckingham Strategic Partners®, collectively Buckingham Wealth Partners. Neither the Securities and Exchange Commission (SEC) nor any other federal or state agency have approved, determined the accuracy, or confirmed the quality of this article. LSR-22-296

About the Author: Larry Swedroe
—
Important Disclosures
For informational and educational purposes only and should not be construed as specific investment, accounting, legal, or tax advice. Certain information is deemed to be reliable, but its accuracy and completeness cannot be guaranteed. Third party information may become outdated or otherwise superseded without notice. Neither the Securities and Exchange Commission (SEC) nor any other federal or state agency has approved, determined the accuracy, or confirmed the adequacy of this article.
The views and opinions expressed herein are those of the author and do not necessarily reflect the views of Alpha Architect, its affiliates or its employees. Our full disclosures are available here. Definitions of common statistics used in our analysis are available here (towards the bottom).
Join thousands of other readers and subscribe to our blog.