Over the long term, low-investment firms have outperformed high-investment firms. This finding has led to the investment factor (CMA, or conservative minus aggressive) being incorporated into the leading asset pricing models—the four-factor q-theory model (market beta, size, investment, and profitability), the Fama-French five-factor model that adds value, and the Fama-French six-factor model that adds momentum. The q-factor model fully subsumes the Fama-French six-factor model in head-to-head factor spanning tests.
Significantly, as shown by Kewei Hou, Chen Xue, and Lu Zhang in their paper “Digesting Anomalies,” firms with lower discount rates (lower costs of capital and thus lower expected returns) invest more. Firms with higher discount rates (higher costs of capital and thus higher expected returns) face higher hurdles for investment and thus invest less. In other words, investment predicts returns because, given expected profitability, high costs of capital imply low net present value of new capital and low investment, and low costs of capital imply high net present value of new capital and high investment. Thus, all else equal, firms with higher investment should earn lower expected returns than firms with lower investment.
In addition, valuation theory predicts that, controlling for a firm’s market value and expected profitability, a company that must invest heavily to sustain its profits should have lower contemporaneous free cash flows to investors than a company with similar profits but lower investment. That is what Eugene Fama and Ken French found in their 2006 paper “Profitability, Investment, and Average Returns.” They also found that while there is no direct way to measure future investment, recent asset growth is a reliable proxy for expected investment, allowing them to measure the effect.
New Research Provides Additional Insights
Shan Chen and Xujun Liu contribute to the literature on the investment factor with their July 2023 study “Dissecting the Expected Investment Growth Premium” in which they decomposed asset growth into externally financed growth (equity and debt financing) and internally financed growth (financed from profits) and constructed expected investment growth measures based on different components. Logically, if a firm can increase its total assets by utilizing retained earnings (instead of issuing debt or equity), a firm with high asset growth is likely to be more profitable, implying a higher expected return.
While Fama and French used asset growth as a proxy for investment, Chen and Liu differentiated between investment [defined as asset growth = total assets (year t) – total assets (year t-1) / total assets (year t-1)] and total investment growth [defined as the change in asset growth = asset growth (year t) – asset growth (year t-1)]. Thus, investment is the same as in Fama and French’s work, but total investment growth is the change in asset growth from year to year. Chen and Liu then attempted to forecast the two components and investigated their asset pricing implications to understand the expected investment growth premium.
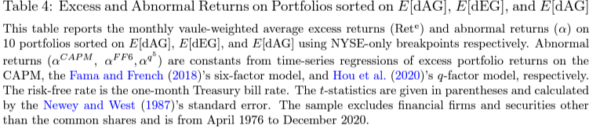
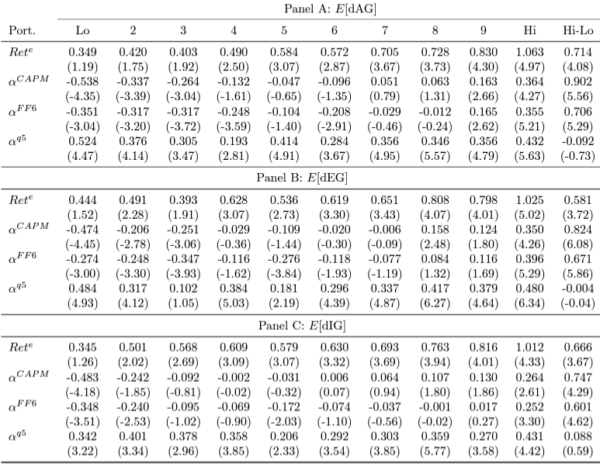
To get expected growth, Chen and Liu adopted the same strategy to forecast future growth as did the authors of the “Digesting Anomalies.” They ran a regression of the change in asset growth on three variables: the log of Tobin’s q, cash-based operating profitability, and the change in return on equity. They used these variables to predict the change in asset growth (dAG), the change in externally financed asset growth (dEG), and the change in internally financed asset growth (dIG). Their data sample covered all firms (except financial firms) listed on the NYSE, AMEX, and Nasdaq over the period July 1963-December 2020. Here is summary of their findings:
- The regressions used to forecast growth of investment provided a good approximation of actual realized growth.
- They confirmed that the expected investment growth premium was positive and robust under various controls—firms with high (low) expected growth in investment had high (low) returns. Note that the expected investment premium was positive rather than negative as in the realized investment case (Fama and French). As shown in Table 4 below, the return increases from 0.349% for decile Lo to 1.063% for decile Hi, and the high-minus-low E[dAG] portfolio (expected change in asset growth) generated an average return of 0.714% (t-statistic = 4.08) per month. Also note that the result was robust to the CAPM and Fama-French six-factor models, though not robust to the q5-factor model (which does include the expected growth factor).
The results are hypothetical results and are NOT an indicator of future results and do NOT represent returns that any investor actually attained. Indexes are unmanaged and do not reflect management or trading fees, and one cannot invest directly in an index.
- For both large and small-cap firms, the expected external investment growth predicted future stock returns positively and subsumed the expected investment growth premium, controlling for other firm characteristics and risk factors.
- Externally financed investment growth persistently predicted returns over time, and its significance remained after five years. On the other hand, the coefficient for internally financed investment growth was indifferent from zero and even became negative after one year, suggesting a weak ability to predict long-term returns.
- Externally financed growth predicted future profitability negatively.
Chen and Liu’s findings are consistent with those of Hongtao Li, author of the 2017 study “External Growth and the Cross Section of Stock Returns,” who found:
- External growth, measured as asset growth raised from capital markets, had stronger power than total asset growth in predicting the cross-section of average returns.
- External growth subsumed the total asset growth effect and outperformed other measures of firm investments in predicting returns.
- The profitability of external growth strategies was not explained by well-documented factors (i.e., market, size, value, profitability, investment, and momentum).
- An external growth factor helped explain a wide range of anomalies—especially, it accounted for nearly half of momentum profits.
Chen and Liu’s findings are also consistent with those of the research team at Dimensional in their 2019 paper “Investment and Expected Stock Returns.” They found that in large caps, spreads in annualized compound returns between the top and bottom quartiles of the asset growth portfolios were negative. However, the return spreads were not reliably different from zero—the results were weak. However, in small caps the difference in average monthly returns between the bottom and top quartiles was 50 basis points and was reliably different from zero—the performance of the investment factor was driven by the significant underperformance of small-cap firms with high asset growth. They also found that the underperformance of the top decile firms persisted, on average, for about two years after sorting. Importantly, they found that equity issuance was the most prominent individual driver of high asset growth among U.S. small caps, followed by debt issuance. And they found that high asset growth firms had poor historical returns regardless of whether firms with merger and acquisition (M&A) activity were included or excluded, suggesting M&A activity was not the only driver of the investment effect.
Finally, Chen and Liu’s finding that firms with high expected growth earned higher expected returns than firms with low expected growth, holding investment and expected profitability constant, is consistent with those of the authors of the study “q5” in which they added expected growth to the q-factor model.
Investor Takeaways
Valuation theory predicts that investment is negatively related to expected returns, all else fixed. Using current asset growth as a proxy for expected investment, high asset growth/high investment growth firms tend to underperform the market. Providing confidence that the findings are not the result of data mining, the evidence is persistent across time and pervasive across the globe and sectors. And, as has been found to be the case with other factors (such as value, momentum, and profitability), small-cap firms are the primary drivers of the underperformance. In addition, it is present across the relative price and profitability segments.
Chen and Liu’s main contributions were to show that while realized asset growth is a negative predictor of returns, their measure of expected investment growth is a positive predictor and that it matters whether the investment was financed externally (debt or equity) or internally. This is consistent with the findings of the authors of the “q5” study.
The investment factor should not be considered in isolation when building portfolios, as profitability and how asset growth is financed (internally or externally) matters. Not all high investment firms (defined as high asset growth) have low expected returns, as those with high profitability and asset growth financed internally have high expected returns. In addition, an efficient way to improve the expected performance of an equity strategy might be to systematically exclude small-cap firms with high externally financed asset growth and/or low expected investment growth.
Larry Swedroe is head of financial and economic research for Buckingham Wealth Partners.
For informational and educational purposes only and should not be construed as specific investment, accounting, legal, or tax advice. Certain information is based on third party data and may become outdated or otherwise superseded without notice. Third party information is deemed to be reliable, but its accuracy and completeness cannot be guaranteed. By clicking on any of the links above, you acknowledge that they are solely for your convenience, and do not necessarily imply any affiliations, sponsorships, endorsements, or representations whatsoever by us regarding third-party websites. We are not responsible for the content, availability, or privacy policies of these sites, and shall not be responsible or liable for any information, opinions, advice, products or services available on or through them. The opinions expressed here are their own and may not accurately reflect those of Buckingham Strategic Wealth or Buckingham Strategic Partners, collectively Buckingham Wealth Partners. Neither the Securities and Exchange Commission (SEC) nor any other federal or state agency have approved, determined the accuracy, or confirmed the adequacy of this article. LSR-23-542

About the Author: Larry Swedroe
—
Important Disclosures
For informational and educational purposes only and should not be construed as specific investment, accounting, legal, or tax advice. Certain information is deemed to be reliable, but its accuracy and completeness cannot be guaranteed. Third party information may become outdated or otherwise superseded without notice. Neither the Securities and Exchange Commission (SEC) nor any other federal or state agency has approved, determined the accuracy, or confirmed the adequacy of this article.
The views and opinions expressed herein are those of the author and do not necessarily reflect the views of Alpha Architect, its affiliates or its employees. Our full disclosures are available here. Definitions of common statistics used in our analysis are available here (towards the bottom).
Join thousands of other readers and subscribe to our blog.