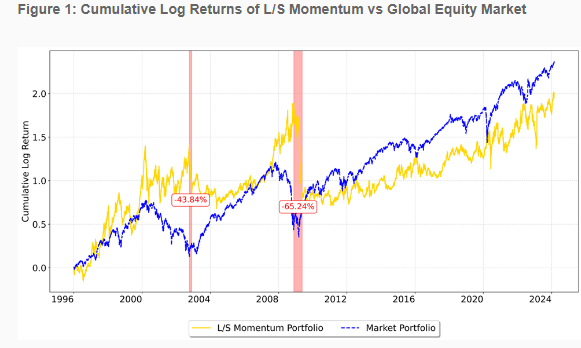
While empirical research on cross-sectional (long-short) momentum has shown high returns, investors have also experienced huge drawdowns—momentum exhibits both high kurtosis and negative skewness. Since 1926, there have been several momentum crashes that featured short but persistent periods of highly negative returns. For example, from June to August 1932, the momentum portfolio lost about 91%, followed by a second drawdown from April to July 1933. Other prominent crashes occurred in the first decade of this century (see chart below).
The results are hypothetical results and are NOT an indicator of future results and do NOT represent returns that any investor actually attained. Indexes are unmanaged and do not reflect management or trading fees, and one cannot invest directly in an index.
In addition, there have been several smaller crashes—in 1938/1939, 1974/1975, and 2001/2002. While smaller in size, each of those comprised at least one monthly loss of more than 19%. Therefore, high monthly returns of 1.15% yielded a large kurtosis of 16.6 and a highly negative skewness of -2.3. The research has also found that the crashes were driven by large gains of previous losers (during reversals). At the same time, winners still exhibited modestly positive returns—explaining why time-series momentum (or trend) has not been subject to such dramatic crashes.
The good news is that researchers have uncovered strategies that have reduced crash risk:
- Pedro Barroso and Pedro Santa-Clara, authors of the 2015 study “Momentum Has Its Moments,” found that the risk of momentum was highly variable over time and predictable by its own realized variance and that there was a negative relationship between momentum volatility and subsequent returns—momentum volatility increases in times of momentum crashes. The management of that risk (by scaling volatility) virtually eliminated crashes and nearly doubled the Sharpe ratio of the momentum strategy. Other studies, including the 2017 study “A Century of Evidence on Trend-Following Investing,” the 2018 study “The Impact of Volatility Targeting,” and the 2019 study “Portfolio Management of Commodity Trading Advisors With Volatility Targeting,” have also found that momentum strategies have benefited from scaling volatility.
- Kent Daniel and Tobias Moskowitz, authors of the study published in the December 2016 issue of the Journal of Financial Economics improved upon Barroso and Santa-Clara’s constant volatility strategy, building a dynamic momentum strategy that scaled exposure based on forecasts of momentum’s mean and variance. They demonstrated that “an implementable dynamic momentum strategy based on forecasts of momentum’s mean and variance approximately doubles the alpha and Sharpe ratio of a static momentum strategy and is not explained by other factors.”
- Dion Bongaerts, Xiaowei Kang, and Mathijs van Dijk, authors of the 2020 study “Conditional Volatility Targeting,” found that scaling strategies could be improved upon by adjusting risk exposures conditional on (extreme) volatility states—their strategy reduced risk exposures during high volatility states, increased risk exposures during low volatility states, and maintained an unscaled exposure otherwise. They found that the conditional strategy not only significantly reduced drawdowns and tail risks across all major equity markets and momentum factors but also reduced turnover. Their findings were consistent with those of Georg Cejnek and Florian Mair, authors of the 2021 study “Understanding Volatility-Managed Portfolios,” who found that while a simple linear regression showed no clear relationship between outperformance and volatility, once volatility exceeded a certain threshold, the volatility-managed portfolio always outperformed the unmanaged strategy.
- Suk-Joon Byun and Byounghyun Jeon, authors of the 2023 study “Momentum Crashes and the 52-Week High,” found that the nearness to a stock’s 52-week high could explain momentum crashes. “Stocks far from peaks outperforming stocks near peaks during the market rebounds are the key to understanding the economic channel behind momentum crashes and momentum profits’ time-variation.”
New Research
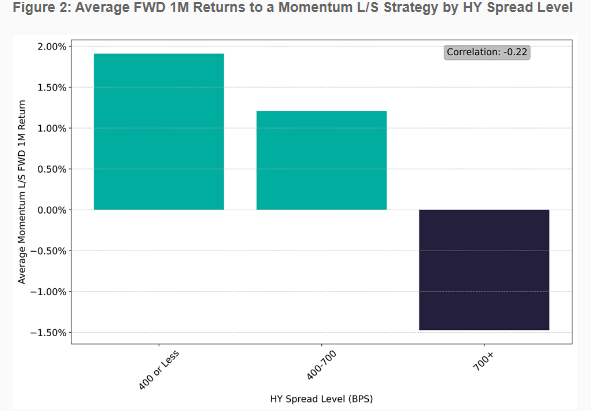
Verdad’s Lionel Smoler-Schatz contributes to the momentum crash literature with his research paper, “A Momentum Crash Course.” Smoler-Schatz found: “There is a strong relationship between the level of high-yield spreads and the one-month returns to the momentum factor. Specifically, tight high-yield spreads are associated with robust momentum premia, while elevated spreads (400-700 basis points) predict weaker returns. The right signal to move out of the momentum strategy—or even to initiate strong bets on reversals—has historically been when spreads exceed 700 basis points.”
The results are hypothetical results and are NOT an indicator of future results and do NOT represent returns that any investor actually attained. Indexes are unmanaged and do not reflect management or trading fees, and one cannot invest directly in an index.
Consistent with prior research findings, Smoler-Schatz found that the “high-yield spread is not a particularly useful predictor of the forward returns of the ‘winner’ portfolio.” However, like the other strategies that have been found to reduce the risk of crashes, the high-yield spread “significantly predicts momentum crashes by identifying when the ‘loser’ portfolios will experience positive reversals.”
Investor Takeaways
The empirical research demonstrates that, on average, investing in previous winners and short-selling previous losers offers highly significant returns that other common risk factors cannot explain. However, momentum also displays a huge tail risk, as there are short but persistent periods of highly negative returns. Crashes particularly occur in reversals from bear markets, when the momentum portfolio displays a negative market beta and momentum volatility is high.
The good news for those incorporating (or considering it) cross-sectional momentum strategies into their portfolio is that we now have a significant body of research that has found that momentum crashes are not only forecastable—occurring following market declines and when market volatility is high (contemporaneous with market rebounds)—but also that there are systematic strategies that have been shown to historically reduce crash risk. Smoler-Schatz showed that the high-yield spread is one of them.
Larry Swedroe is head of financial and economic research for Buckingham Wealth Partners, collectively Buckingham Strategic Wealth, LLC and Buckingham Strategic Partners, LLC.
The opinions expressed here are their own and may not accurately reflect those of Buckingham Wealth Partners. For informational and educational purposes only and should not be construed as specific investment, accounting, legal, or tax advice. Neither the Securities and Exchange Commission (SEC) nor any other federal or state agency have approved, determined the accuracy, or confirmed adequacy of this article. Investing involves risk. Past performance is not indicative of future performance. Certain information may be based on third party data and may become outdated or otherwise superseded without notice. Third-party information is deemed reliable, but its accuracy and completeness cannot be guaranteed. LSR-24-640

About the Author: Larry Swedroe
—
Important Disclosures
For informational and educational purposes only and should not be construed as specific investment, accounting, legal, or tax advice. Certain information is deemed to be reliable, but its accuracy and completeness cannot be guaranteed. Third party information may become outdated or otherwise superseded without notice. Neither the Securities and Exchange Commission (SEC) nor any other federal or state agency has approved, determined the accuracy, or confirmed the adequacy of this article.
The views and opinions expressed herein are those of the author and do not necessarily reflect the views of Alpha Architect, its affiliates or its employees. Our full disclosures are available here. Definitions of common statistics used in our analysis are available here (towards the bottom).
Join thousands of other readers and subscribe to our blog.