Because of the strong evidence, momentum continues to receive much attention from researchers. Out of the hundreds of exhibits in the factor zoo, one of just five equity factors that met all the criteria (persistent, pervasive, robust, implementable, and intuitive) Andrew Berkin and I established in our book “Your Complete Guide to Factor-Based Investing” was momentum (both cross-sectional [long-short] and absolute [trend]).
While the original 1993 research on momentum by Narasimhan Jegadeesh and Sheridan Titman focused solely on U.S. common stock returns, momentum (both cross-sectional and trend) has been found pretty much everywhere: in global stocks, government and corporate bonds, commodities, currencies, stock portfolios, industries, and countries.
New Research
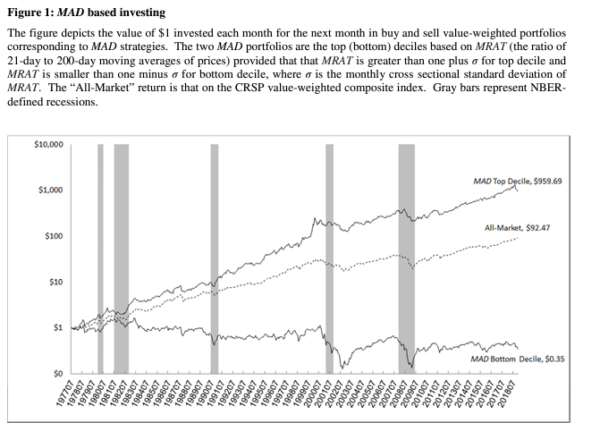
Doron Avramov, Guy Kaplanski, and Avanidhar Subrahmanyam contribute to the momentum literature with their December 2023 study “Moving Average Distance as a Predictor of Equity Returns.” They examined whether the distance between 21- and 200-day moving averages predicted equity returns. Their database covered all U.S. common stocks listed on the NYSE, AMEX, and Nasdaq with positive equity book value in Compustat for the previous year. They excluded stocks with an end-of-month price below $5, stocks not traded during the month, and stocks that did not have return or earnings observations for the previous 12 months. The period covered was July 1977-December 2018.
To build long-short portfolios, they selected stocks with the most extreme distance from the two moving averages (the top and bottom decile of stocks). Their analysis controlled for 18 variables from the literature (such as measures of size, value, trend, liquidity, asset growth, unexpected earnings growth, profitability, investment, and idiosyncratic volatility). Following is a summary of their findings:
- The distance between short- and long-run moving averages of prices (MAD) predicted future equity returns in the cross-section.
- Large (small) ratios of 21-day (short-term) to 200-day (long-term) moving averages of prices predicted high (low) average returns in the cross-section.
The results are hypothetical results and are NOT an indicator of future results and do NOT represent returns that any investor actually attained. Indexes are unmanaged and do not reflect management or trading fees, and one cannot invest directly in an index.
- Their results were robust to other short-term moving averages ranging from five to 35 trading days.
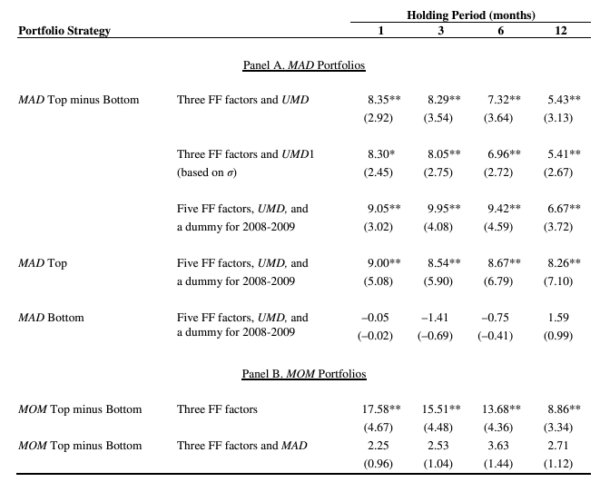
- The MAD strategy yielded alphas ranging from 5.43% (t = 3.13) for the 12-month horizon and 8.35% (t = 2.92) for the three-month horizon.
Table 4. Annual alphas from MAD portfolios. The table reports annual alphas (in %) and their t-values (in parentheses) obtained from regressing monthly decile-based hedge portfolio returns on the three/five Fama-French factors along with two alternative versions of momentum (UMD). Stock returns are value weighted. Annual alphas are obtained by multiplying monthly alphas by 12 (no compounding). The MAD decile takes long (short) position in the top (bottom) MRAT decile (where MRAT is the ratio of 21-day to 200-day moving averages of prices), as long as the MRAT distance from one is at least σ, the monthly cross-sectional standard deviation of all stocks’ MRAT. UMD is the momentum factor from Ken French’s website. The UMD1 factor mimics monthly returns on a portfolio that buys a subset of top momentum decile stocks whose returns over the past two to 12 months exceed a constant σ and sells those bottom momentum decile stocks whose returns over the past two to twelve months fall below minus σ. We estimate σ as the monthly cross-sectional standard deviation of returns over the past two to 12 months. The sample is from July1977 to December 2018. One and two asterisks indicate significance at the 5% and 1% levels, respectively.
The results are hypothetical results and are NOT an indicator of future results and do NOT represent returns that any investor actually attained. Indexes are unmanaged and do not reflect management or trading fees, and one cannot invest directly in an index.
- While the MAD effect declined as the horizon increased, it was present even after 12 months and did not reverse—the same held true up to 36 months after portfolio formation.
- MAD’s predictability went beyond momentum, 52-week highs, profitability, and other prominent anomalies.
- MAD-based investment payoffs survived reasonable trading costs faced by institutions and were stronger on the long side relative to the short counterpart.
- MAD robustly prevailed in states of high and low sentiment, liquidity, and volatility.
- While the MAD effect remained statistically and economically significant after accounting for momentum, the profitability of the standard momentum factor (UMD) was insignificant in the presence of a MAD factor.
- The MAD-based strategy remained viable in the Fama-French five-factor model.
- Unlike standard momentum, MAD continued to produce economically meaningful payoffs in the most recent years.
Behavioral Explanation
Avramov, Kaplanski, and Subrahmanyam provided a behavioral explanation for the MAD effect—it occurs because investors get anchored to long-run moving averages.
“As an example, suppose the anchor (the long-run moving average) is 40. Now suppose that recent public news suggests that the price should be 60. The number 60 is so far away from 40 that the investor underreacts. This implies that the short-run moving average adjusts only to, say, 50 (reflecting a large distance of 10), and the price, which still has a distance of 10 to cover, subsequently drifts upward to 60. Suppose the anchor is 40 and information flows indicate that the price should be 41. This is not far from the anchor, so the mis-reaction is minimal, and the price quickly adjusts to 41. This argument demonstrates how the distances between short- and long-run moving averages reflect the degree of underreaction in prices. The anchoring hypothesis predicts that MAD should be stronger for sudden (versus gradual) changes in the current values of prices relative to their long-term averages, which is when the degree of underreaction should be greater.”
Their evidence supported the hypothesis.
Their findings led Avramov, Kaplanski, and Subrahmanyam to conclude:
“Our research suggests that active managers should pay attention to the distance between short- and long-run moving averages of prices in developing models for forecasting equity returns. We show that trading rules based on this distance present significant profits in historical data after accounting for reasonable trading cost estimates.”
Investor Takeaways
When considering the findings, investors should note that, unlike individual stocks that exhibit reversals (Ken French’s short-term reversal factor, STREV) at very short horizons (such as one week and one month), liquid futures markets in macro assets exhibit trends (continuation) at the one-month horizon. And because the evidence shows that there are times when short signals outperform longer signals, combining short and long signals can provide a diversification benefit. With that in mind, in their managed futures strategy funds (AQMIX and QMHIX), AQR Capital Management combines short- and longer-term signals in their momentum strategies.
For investors that use trend-following strategies, Avramov, Kaplanski, and Subrhmanyam provided new evidence supporting momentum strategies and showed that the distance between short- and longer-term momentum signals provides additional explanatory power in the cross-section of equity returns.
Larry Swedroe is head of financial and economic research for Buckingham Wealth Partners, collectively Buckingham Strategic Wealth, LLC and Buckingham Strategic Partners, LLC.
For information and educational purposes only and should not be construed as specific investment, accounting, legal, or tax advice. Certain information is based on third party data and may become outdated or otherwise superseded without notice. Third party information is deemed to be reliable, but its accuracy and completeness cannot be guaranteed. Mentions of specific securities are for informational purposes only to show funds with long- and short-term signals. These should not be construed as a recommendation of securities shown. Individuals should speak with a qualified financial professional based on their circumstances. The opinions expressed here are their own and may not accurately reflect those of Buckingham Strategic Wealth, LLC or Buckingham Strategic Partners, LLC, collectively Buckingham Wealth Partners. Neither the Securities and Exchange Commission (SEC) nor any other federal or state agency have approved, determined the accuracy, or confirmed the adequacy of this article.LSR-23-606

About the Author: Larry Swedroe
—
Important Disclosures
For informational and educational purposes only and should not be construed as specific investment, accounting, legal, or tax advice. Certain information is deemed to be reliable, but its accuracy and completeness cannot be guaranteed. Third party information may become outdated or otherwise superseded without notice. Neither the Securities and Exchange Commission (SEC) nor any other federal or state agency has approved, determined the accuracy, or confirmed the adequacy of this article.
The views and opinions expressed herein are those of the author and do not necessarily reflect the views of Alpha Architect, its affiliates or its employees. Our full disclosures are available here. Definitions of common statistics used in our analysis are available here (towards the bottom).
Join thousands of other readers and subscribe to our blog.