“Conventional wisdom” can be defined as ideas that are so accepted that they go unquestioned. Unfortunately, conventional wisdom is often wrong. Two examples are that millions of people once believed the conventional wisdom that the Earth is flat, and millions also believed that the Earth is the center of the universe. An example of conventional wisdom in investing is: “Don’t just stand there! Do something!” The new version is: “Don’t do something. Just stand there.” In other words, adhere to your plan.
Another example of investment conventional wisdom is to “cut your losses and let your profits run.” It is accredited to 18th-century economist David Ricardo. Is it good advice? In a study published in the November 2023 issue of The Journal of Portfolio Management, Dirk Baur and Thomas Dimpfl tested the wisdom of the strategy for large-cap U.S. stocks. They assumed an initial equal (1/N) weighting of stocks in a portfolio. They tested whether an adjustment of the portfolio based on the two strategies, “cut your losses” and “cut your profits” (to explicitly test “let your profits run”), led to superior returns. They analyzed this question for different portfolio sizes (number of stocks), different investment periods (starting dates and end dates), and different thresholds for cutting losses and letting profits run.
They randomly sampled N stocks from a larger pool of stocks and invested $100 in each of the N stocks. Both the time of purchase (t0) and the holding period (until t1) were randomly chosen under the constraint that the holding period was at least six months. They used thresholds from 0% to -100% for the cut-your-losses strategy and thresholds from 0% to 300% for the cut-your-profits strategy. The thresholds were different because the downside was bounded at -100%, whereas the upside was not bounded. If the holding period return (stock return since purchase and formation of the portfolio) was below the cut-your-losses threshold, the stock was sold and the proceeds were kept as cash accruing 0% interest. Similarly, if the holding period return was above the cut-your-profits threshold, the stock was sold and the proceeds were kept in the portfolio as cash accruing 0% interest.
Portfolios were randomly drawn from two different samples: the constituents of the S&P 500 Index and a Center for Research in Security Prices (CRSP) sample of large U.S. stocks with a market capitalization greater than $1 billion as of March 2022. Their data samples covered the period 2000-2021. As you review the results, keep in mind that the authors ignored transaction costs. Following is a summary of their findings:
- Any cut-your-losses strategy underperformed the buy-and-hold strategy, reducing returns while increasing volatility. The results were similar for both data samples.
- The results were robust to monthly, quarterly, and annual data and even for daily data around the 2008 Financial Crisis and the 2020 COVID-19 outbreak.
- If the cut-your-profits thresholds were confined to 0% to +100%, the mean underperformance would have been significantly larger.
- Cutting losses during the 2008 crisis performed better than the benchmark for half of all portfolios but not consistently and not during the 2020 crisis.
- The poor performance of the adage was due to a weak downside momentum relative to a comparably strong upside momentum – the mean underperformance of the cut-your-profits strategy was about four times worse than the mean underperformance of the cut-your-losses strategy.
- The rare cases of outperformance were due to relatively short investment periods in which winner and loser stocks were persistent, that is, continued to be winners or losers, respectively – this persistence was key to the success of the adage.
The results questioned the relevance of the disposition effect (ride winners too short and losers too long), as they did not find any evidence that holding losers too long was bad for investors.
Cut Losses: Summary Statistics for 25 and 50 Stocks Randomly Chosen and Randomly Chosen Sample Period
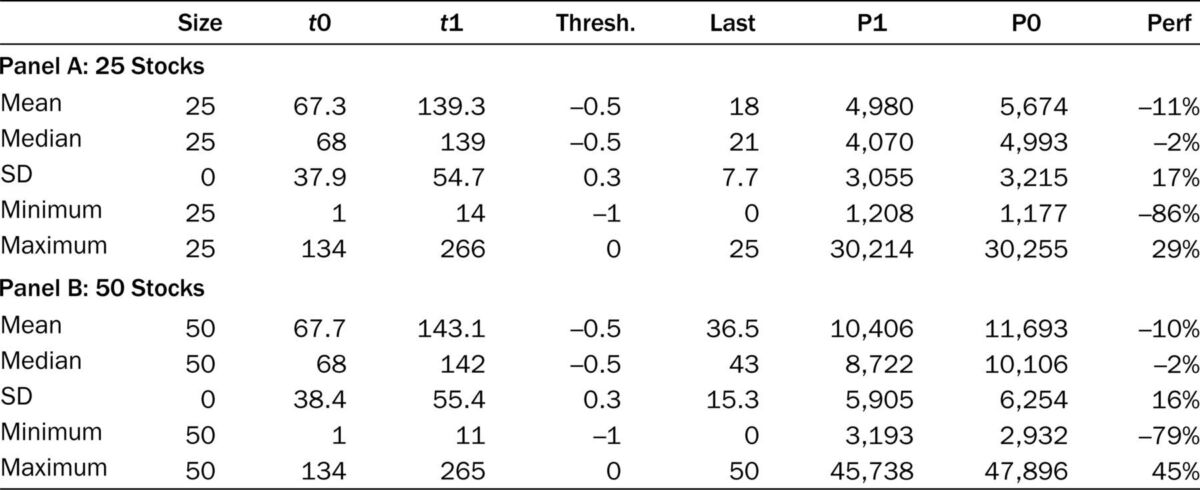
NOTES: This exhibit presents the summary statistics (mean, median, SD, minimum, maximum) of all simulations. Size denotes average portfolio size at t0, t0, and t1 denote the randomly picked investment period (start and end date), thresh. denotes the threshold to cut losses or cut profits, last denotes the final number of assets in the portfolio, P1 denotes the total portfolio return, P0 denotes the benchmark buy-and-hold return, and perf denotes the relative performance of P1 relative to P0 in percentages.
The results are hypothetical results and are NOT an indicator of future results and do NOT represent returns that any investor actually attained. Indexes are unmanaged and do not reflect management or trading fees, and one cannot invest directly in an index
Their findings led Baur and Dimpfl to conclude: “Remarkably, despite the fact that the investment adage is widely known, we do not find any evidence that ‘cut your losses’ is a good strategy. Furthermore, we analyze crisis periods and observe that any cut-your-losses strategy works much better in such periods than in normal periods but still does not lead to a clear outperformance either.” They added that their results were in contrast with the “symmetric expectations about winner and loser stocks embedded in the adage because both winner and loser stocks are expected to remain winners and losers.”
Baur and Dimpfl did note: “It is possible that the findings of this article only hold for large stocks and do not extend to smaller stocks or different asset classes.”
Investor takeaways
“Cut your losses” is not a good strategy, as it underperformed the benchmark buy-and-hold portfolio. As Baur and Dimpfl noted, “Losing stocks rarely continue to fall, which is not surprising in a world where stock markets rise and economies grow on average. In other words, if a rising tide lifts all boats, a cut-your-losses strategy cannot work.”
The upside equivalent, “cut your profits,” also clearly underperformed, leading to much larger losses relative to the benchmark than the cut-your-losses strategy. This strategy fails because positive momentum is stronger than negative momentum.
Investors are best served by adhering to their investment strategy and rebalancing as required (while engaging in tax-loss selling as appropriate but immediately investing in a comparable security).
Be careful before acting on what is considered to be conventional wisdom. Make sure it’s supported by empirical evidence. In this case, the evidence clarifies that “cut your losses and let your profits run” should not be conventional wisdom.
Larry Swedroe is head of financial and economic research for Buckingham Wealth Partners, collectively Buckingham Strategic Wealth, LLC and Buckingham Strategic Partners, LLC.
For informational and educational purposes only and should not be construed as specific investment, accounting, legal, or tax advice. Certain information is based on third party data and may become outdated or otherwise superseded without notice. Third party information is deemed to be reliable, but its accuracy and completeness cannot be guaranteed. Neither the Securities and Exchange Commission (SEC) nor any other federal or state agency have approved, determined the accuracy, or confirmed the adequacy of this article. LSR-23-589

About the Author: Larry Swedroe
—
Important Disclosures
For informational and educational purposes only and should not be construed as specific investment, accounting, legal, or tax advice. Certain information is deemed to be reliable, but its accuracy and completeness cannot be guaranteed. Third party information may become outdated or otherwise superseded without notice. Neither the Securities and Exchange Commission (SEC) nor any other federal or state agency has approved, determined the accuracy, or confirmed the adequacy of this article.
The views and opinions expressed herein are those of the author and do not necessarily reflect the views of Alpha Architect, its affiliates or its employees. Our full disclosures are available here. Definitions of common statistics used in our analysis are available here (towards the bottom).
Join thousands of other readers and subscribe to our blog.