
Last month, I mentioned that CPI inflation measures were based on lagging BLS measures of Owners’ Equivalent Rent (OER).
BLS highlighted housing prices, headlining the CPI report as “CPI for all items rose 0.3% in January; shelter up”
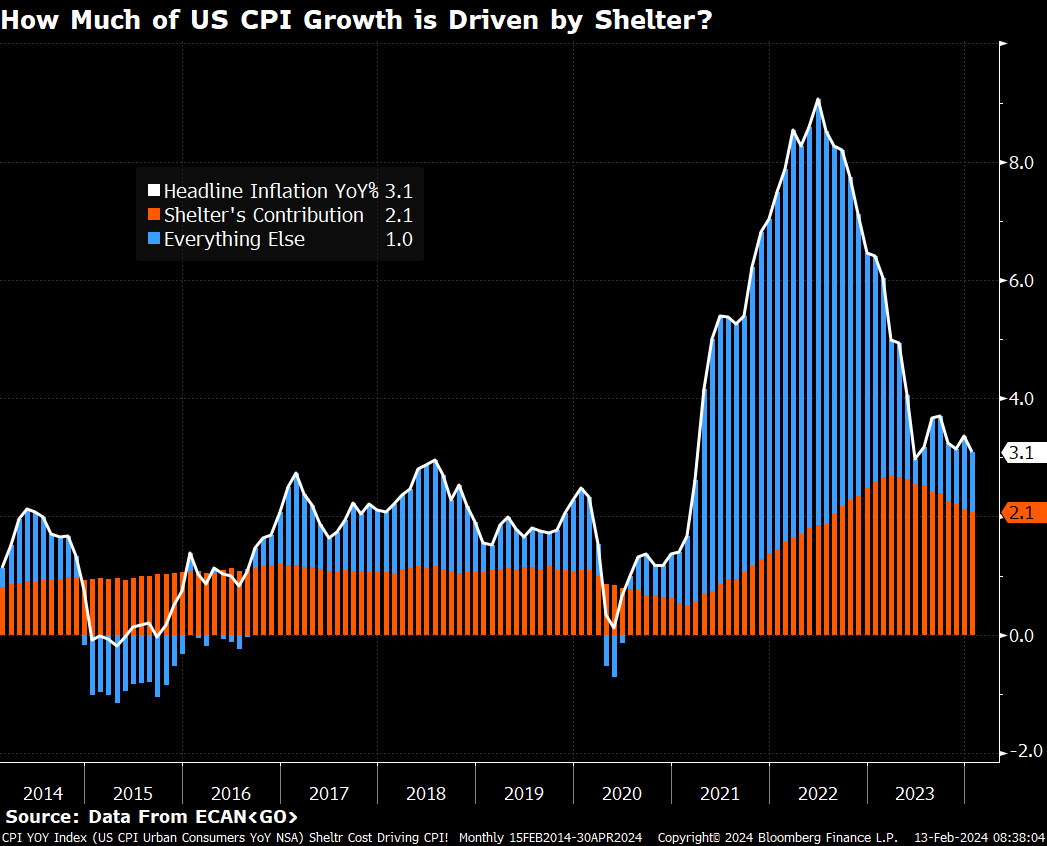
As the chart above shows, Shelter was 2/3rds of the increase in the most recent. (Chart thanks to Michael McDonough).
We all know OER lags real-world prices — I used to spitball this at 3-6 months. But this week’s podcast guest, former NY Fed President Bill Dudley, tells me the lag is closer to 6-12 months. So BLS uses a measure of shelter for its inflation calculation that might actually lag behind actual prices by as much as a year.
That puts this week’s big sell-off into proper perspective. It was a reaction to data that was either old or very old. It would not surprise me to see that as people figure this out, we claw back that sell-off over the next few days or weeks.
The ever-present question: How much does the FOMC recognize how behind the curve this data is?
Previously:
CPI Increase is Based on Bad Shelter Data (January 11, 2024)
How Everybody Miscalculated Housing Demand (July 29, 2021)
