
Over the weekend, I noticed someone was wrong on the internet.
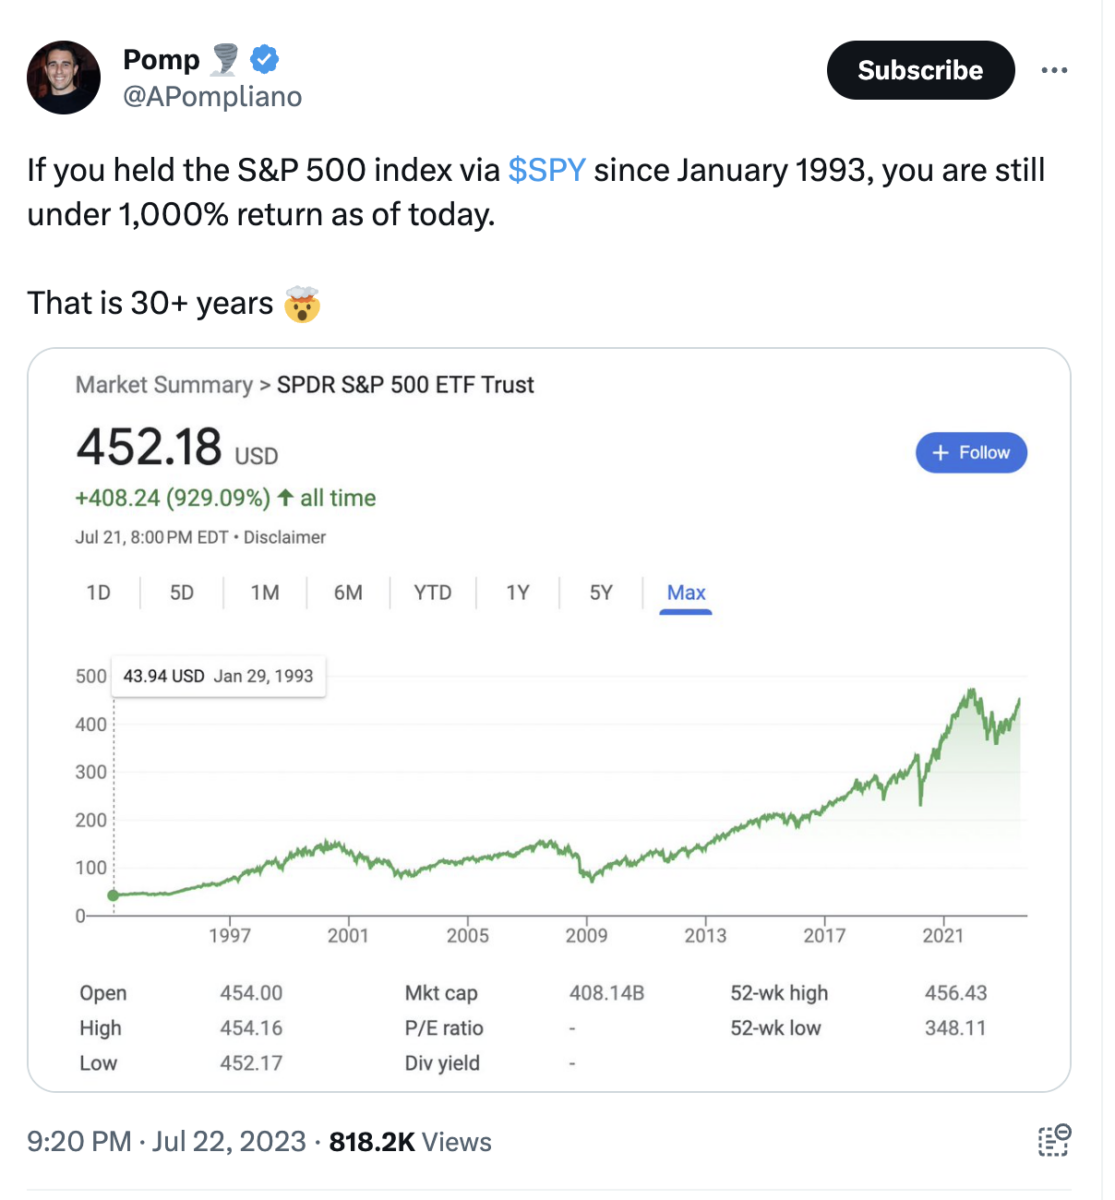
Anthony Pompliano is a crypto fan who has amassed a huge (1.6 million) following on Twitter. As the Tweet (X?) above shows, he made a newbie error looking at the performance of the S&P500: He left out dividends, thereby omitting most of the returns.
I replied1 to the tweet, politely pointing out that my colleague Ben Carlson had previously explained that “since 1928, equity market returns including dividends are 70% higher than just equity price returns alone.”
Indeed, dividends are a major reason why you hold equities long-term. “The total return is around 35x higher than the price return alone.” 2
But here is where things get interesting. Pomp points out that:
“I am, however, arguing that the total return percentage traditionally quoted is not what people actually achieve in their brokerage account because of taxes. Also, given you have to turn DRIP on in most brokerage accounts, I wonder what percentage of investors reinvest as well (have looked but can’t seem to find this number anywhere).”
I have addressed Tax Alpha before (see this and this); and obviously, the same situation (or worse) exists for other asset classes, including crypto.
But Pomp indirectly raised a very different issue: Why do people underperform their own assets? He was essentially referring to the entire field of behavioral finance.
BeFin explains why people underperform their own holdings.
 In order to obtain returns that mirror your own holdings over an extended period of time, you have to 1) own them for the entire period; 2) originally made your purchase during normal periods of price, e.g., not chasing the new hotness upwards and buying near all-time highs; and 3) not sell prematurely, or trade or otherwise interfere with the power of compounding.
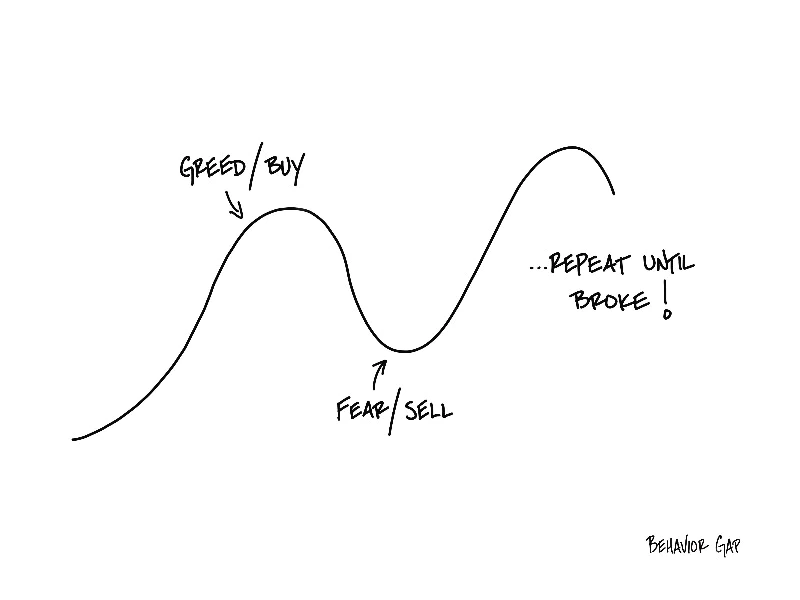
It’s “Simple, But Hard” — simple in the abstract, but difficult to execute in the real world. Most of us lack the understanding, discipline, and skill to do this effectively. Carl Richards termed this the Behavior Gap, and that descriptor sums the challenges up perfectly.
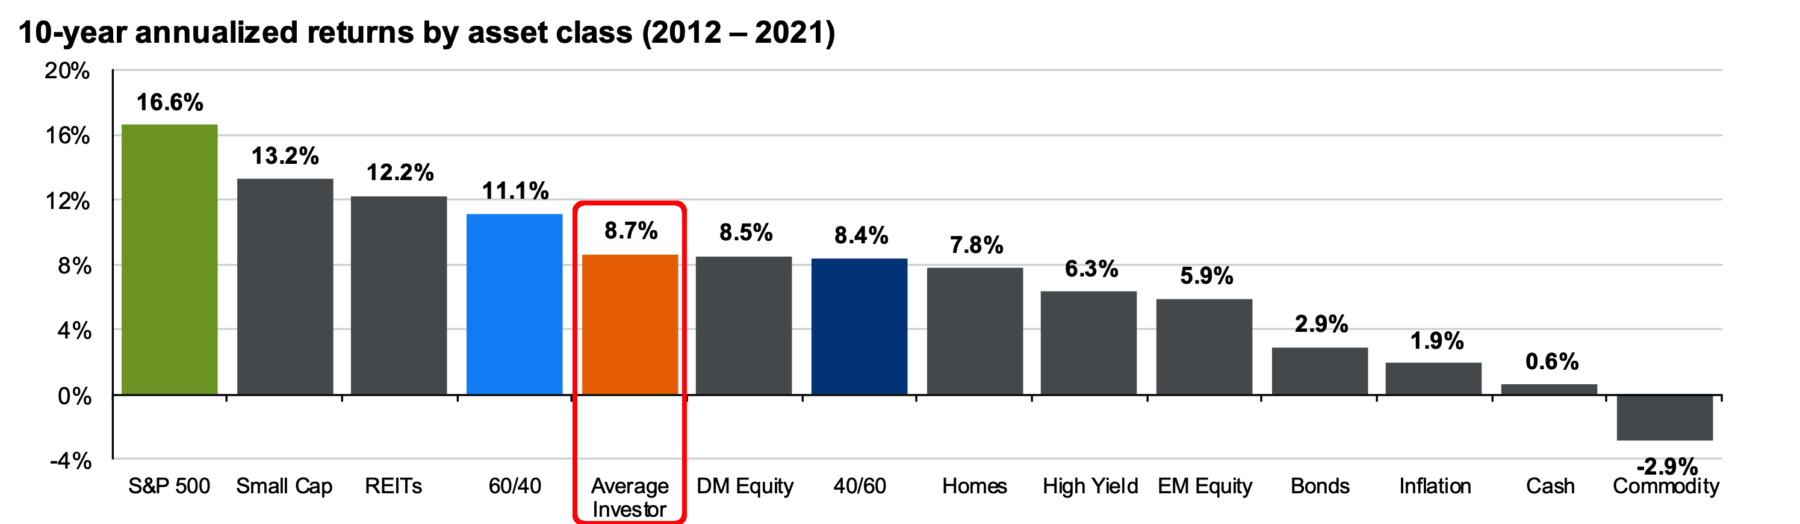
If you are more of a visual person, then consider the two charts below, via JPM’s Quarterly Guide to the Markets. They show just how much the average investor’s lack of discipline costs them in terms of returns. That underperformance between asset class returns and investor returns is the behavior gap.
Over 10 years, (2012-2021) the SPX generated 16.6% annual returns, but the average investor only gained 8.7% per year. Over that period, the typical investor garnered about half of what the markets generated:
Where things really went off the rails were the 20-year returns,w which included most of the dot com implosion, and all of the Great Financial Crisis. Over that volatile era, the SPX returned 9.5% annually while investors garnered about 3.6% per year — barely a third of the index.
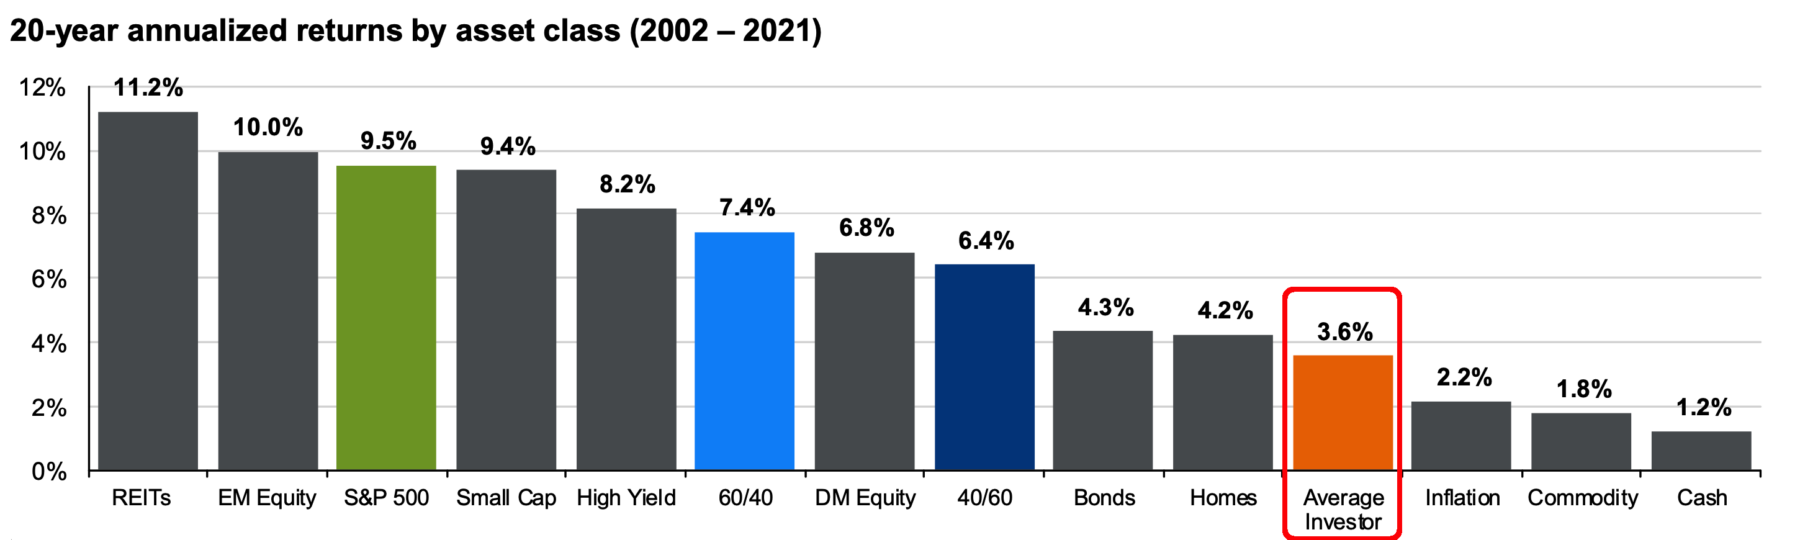
The longer the holding period, the greater the impact of compounding error. This is the cost fo the behavior gap.
Asset classes, be they traditional stocks and bonds, or newer holdings like crypto all have the same defect: They are held, for better or worse, by humans…
Previously:
Simple, But Hard (January 30, 2023)
Tax Alpha (April 14, 2022)
Accessing Losses via Direct Indexing (April 14, 2021)
__________
1. On my backup account – I still don’t have access to my actual account!
2. Carlson observes that from 1928 to 2022, the S&P500 returned 21,519%, which does not seem too shabby, until you consider that with dividends re-invested, SPX returns shoot up to 750,000%. That is home much higher compounding over nearly a century is when you consider 5.8% annual returns versus 9.9%.
