
Source: FRED
Wealth disparities get ever more lopsided the higher up the economic strata you climb; there is more disparity with the top 1% than the top 10%, but the biggest spreads are at the top 0.1% (and above).
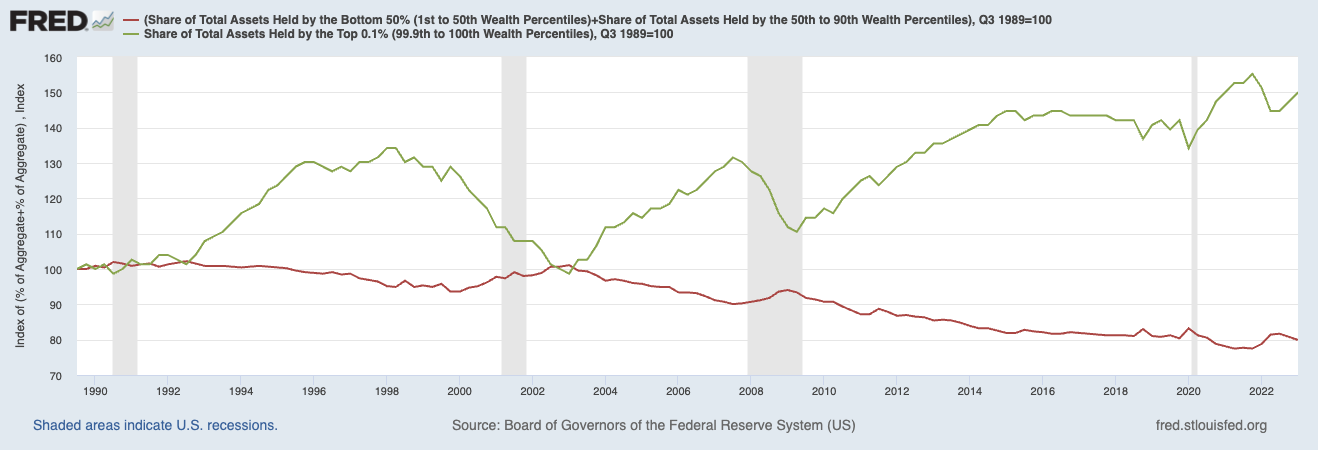
Consider the chart at top, created by Invictus via FRED. It shows “Share of Total Assets Held by the Bottom 90% (red line) versus the Share of Total Assets Held by the Top 0.1% (green line). That spread is currently just about as wide as its ever been. I am intrigued by these sorts of analyses, even if they don’t lead to any immediate conclusions.
There are about 1.6 million households that fall into the 1% category; 160,000 in the 0.1%, and a mere 16,000 are in the 0.01% (not depicted here).
As we noted last December, the required minimum wealth at each decile tier is surprisingly broad:
$38 million for the top 0.1%;
$10 million for next 0.9% (the rest of the top 1%)
$1.8 million for next 9% (rest of top 10%)
$165,382 next 40% (rest of top half)
0$ for the bottom 50%
These are order-of-magnitude changes at each level of wealth. And, it has accelerated over the past few decades. Using IRS data, the 2014 study by the University of California at Berkeley’s professors Emmanuel Saez and Gabriel Zucman’s found:
“The share of total wealth of the top 1% has increased steadily, from below 25% in 1978 to 42% in 2012. The share of total wealth of the top 0.1% has roughly tripled, and the share of the 0.01% has more than quintupled. The top 0.01% of US households had at least $111 million in net worth in 2012, compared to $4 million for the 1%.”
I suspect most people don’t have any idea about these numbers, and imagine the various starts to be closer together in dollar amounts than they actually are.
I am not sure what any of this means, but it’s a fascinating issue; I am glad the Fed and FRED make this data available…
See also:
Never Mind the 1 Percent. Let’s Talk About the 0.01 Percent
By Howard R. Gold
Chicago Booth Review, November 29, 2017
Previously:
Top 0.1%: How Much Wealth Does It Take? (December 5, 2022)
The Super Wealthy versus the Merely Rich (February 7, 2022)
Wealth Distribution in America (April 11, 2019)
Composition of Wealth Differs: Middle Class to the Top 1% (June 5, 2019)
Wages in America (2013-2021)
