 RSS Feed
 by Calculated Risk on 1/05/2024 09:26:00 AM
Friday, January 05, 2024
Comments on December Employment Report
The headline jobs number in the December employment report was above expectations, however employment for the previous two months was revised down by 71,000, combined. The participation rate and the employment population ratio both decreased, and the unemployment rate was unchanged at 3.7%.
Leisure and hospitality gained 40 thousand jobs in December. At the beginning of the pandemic, in March and April of 2020, leisure and hospitality lost 8.2 million jobs, and are now down 163 thousand jobs since February 2020. So, leisure and hospitality has now added back about 98% all of the jobs lost in March and April 2020.
Construction employment increased 17 thousand and is now 448 thousand above the pre-pandemic level.
Manufacturing employment increased 6 thousand jobs and is now 201 thousand above the pre-pandemic level.
Seasonal Retail Hiring
Typically, retail companies start hiring for the holiday season in October, and really increase hiring in November. Here is a graph that shows the historical net retail jobs added for October, November and December by year.
 This graph really shows the collapse in retail hiring in 2008. Since then, seasonal hiring had increased back close to more normal levels. Note: I expect the long-term trend will be down with more and more internet holiday shopping.
Retailers hired 120 thousand workers Not Seasonally Adjusted (NSA) net in December. This was above last year.
This was seasonally adjusted (SA) to a gain of 17 thousand jobs in December.
Prime (25 to 54 Years Old) Participation
 Since the overall participation rate is impacted by both cyclical (recession) and demographic (aging population, younger people staying in school) reasons, here is the employment-population ratio for the key working age group: 25 to 54 years old.
The 25 to 54 years old participation rate declined in December to 83.2% from 83.3% in November, and the 25 to 54 employment population ratio declined to 80.4% from 80.7% the previous month.
Both are close to the pre-pandemic levels.
Average Hourly Wages
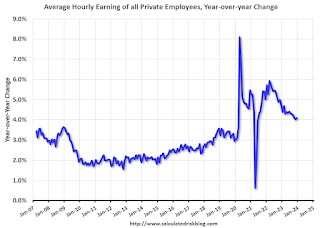 The graph shows the nominal year-over-year change in "Average Hourly Earnings" for all private employees from the Current Employment Statistics (CES).
Average Hourly Wages
 The graph shows the nominal year-over-year change in "Average Hourly Earnings" for all private employees from the Current Employment Statistics (CES).
 There was a huge increase at the beginning of the pandemic as lower paid employees were let go, and then the pandemic related spike reversed a year later.
Wage growth has trended down after peaking at 5.9% YoY in March 2022 and was at 4.1% YoY in December.
Wage growth has trended down after peaking at 5.9% YoY in March 2022 and was at 4.1% YoY in December.
Part Time for Economic Reasons
 From the BLS report:
"The number of persons employed part time for economic reasons, at 4.2 million, changed little in December but was up by 333,000 over the year. These individuals, who would have preferred full-time employment, were working part time because their hours had been reduced or they were unable to find full-time jobs."The number of persons working part time for economic reasons decreased in December to 4.21 million from 3.99 million in November. This is at pre-recession levels.
These workers are included in the alternate measure of labor underutilization (U-6) that increased to 7.1% from 7.0% in the previous month. This is down from the record high in April 2020 of 23.0% and up from the lowest level on record (seasonally adjusted) in December 2022 (6.5%). (This series started in 1994). This measure is close to the 7.0% level in February 2020 (pre-pandemic).
Unemployed over 26 Weeks
 This graph shows the number of workers unemployed for 27 weeks or more.
 According to the BLS, there are 1.245 million workers who have been unemployed for more than 26 weeks and still want a job, up from 1.220 million the previous month.
This is down from post-pandemic high of 4.174 million, and up from the recent low of 1.050 million.
This is close to pre-pandemic levels.
Job Streak
Summary:
The headline monthly jobs number was above consensus expectations; however, employment for the previous two months was revised down by 71,000, combined. The participation rate and the employment population ratio both decreased, and the unemployment rate was unchanged at 3.7%.
This is close to pre-pandemic levels.
Job Streak
Through December 2023, the employment report indicated positive job growth for 36 consecutive months, putting the current streak in 5th place of the longest job streaks in US history (since 1939).
| Headline Jobs, Top 10 Streaks | ||
|---|---|---|
| Year Ended | Streak, Months | |
| 1 | 2019 | 100 |
| 2 | 1990 | 48 |
| 3 | 2007 | 46 |
| 4 | 1979 | 45 |
| 5 | 20231 | 36 |
| 6 tie | 1943 | 33 |
| 6 tie | 1986 | 33 |
| 6 tie | 2000 | 33 |
| 9 | 1967 | 29 |
| 10 | 1995 | 25 |
| 1Currrent Streak | ||
Summary:
The headline monthly jobs number was above consensus expectations; however, employment for the previous two months was revised down by 71,000, combined. The participation rate and the employment population ratio both decreased, and the unemployment rate was unchanged at 3.7%.
Another solid employment report.


