
Fed Chair Jerome Powell and the FOMC increased the Fed Funds Rate another 75 bps yesterday, to 3.75-4.0%. Markets have given back much of October’s gains fairly quickly.
I have been turning this over slowly in my mind, trying to assess their thinking here. I am not sure what models they use, what data they think is most important, what impact their actions will have, and perhaps most importantly, exactly what they are hoping to accomplish.
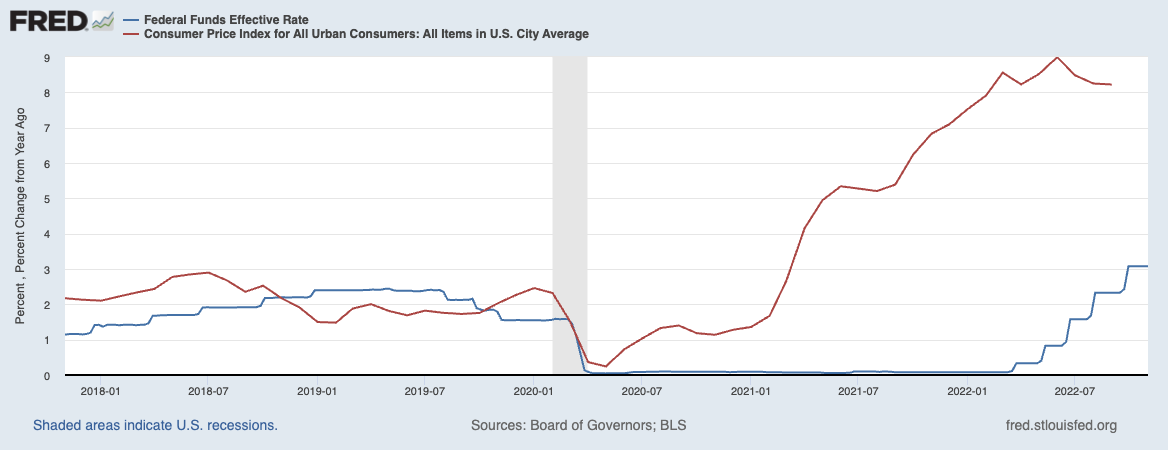
I direct your attention to the chart of CPI and Fed Funds Rate above.
I don’t care what your personal theories on monetary policy might be, your thoughts on Milton Friedman, or who you plan on voting for next week. Instead, I challenge anyone to look at that chart and tell me this crew has the slightest idea WTF they are doing.
In March 2001, CPI ticked through the Fed’s 2% inflation target, and their reaction was . . . nothing. They remained on the emergency footing of zero. A few months later, CPI was over 4%; by June, it was over 5%, October, higher than 6%, and they finished 2021 with CPI over 7%. And still, crickets. It wasn’t until March 2022, 2 years after the pandemic panic, that the FOMC deemed it ok to start raising rates.
The conclusion which disturbs me is that the very same Fed that was way late in recognizing that inflation was spiking is now way late in recognizing that it has peaked and reversed. The results could include job losses, falling home values, slowing consumer spending, and perhaps even a painful recession.
Previously:
When Your Only Tool is a Hammer (November 1, 2022)
How the Fed Causes (Model) Inflation (October 25, 2022)
Why Is the Fed Always Late to the Party? (October 7, 2022)
Who Is to Blame for Inflation, 1-15 (June 28, 2022)
How Everybody Miscalculated Housing Demand (July 29, 2021)
