 RSS Feed
 by Calculated Risk on 8/30/2022 02:08:00 PM
Tuesday, August 30, 2022
Las Vegas July 2022: Visitor Traffic Down 5.3% Compared to 2019
Note: I like using Las Vegas as a measure of recovery for both leisure (visitors) and business (conventions).
From the Las Vegas Visitor Authority: July 2022 Las Vegas Visitor Statistics
July saw the highest monthly visitation since the start of the pandemic, reaching nearly 3.5M visitors for the month, up 5.7% YoY and just 5.3% below the July 2019 tally.
Overall hotel occupancy reached 83.4%, 4.0 pts ahead of last July but down 7.7 pts vs. July 2019. Weekend occupancy exceeded 91% (up 3.0 pts YoY but down 6.1 pts vs. July 2019), while Midweek occupancy reached 79.1% (up 4.5 pts YoY but down 9.6 pts vs. July 2019).
ADR exceeded $160, 5.5% ahead of last July and over 26% above July 2019 while RevPAR approached $134 for the month, +10.8% YoY and +15.7% over July 2019
 Click on graph for larger image.
 The first graph shows visitor traffic for 2019 (dark blue), 2020 (light blue), 2021 (yellow) and 2022 (red)
Visitor traffic was down 5.3% compared to the same month in 2019.
Visitor traffic was up 5.7% compared to last July.
The second graph shows convention traffic.
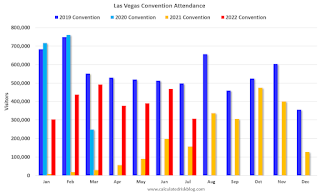
Convention traffic was down 38.4% compared to July 2019.The second graph shows convention traffic.

Note: There was almost no convention traffic from April 2020 through May 2021.


