 RSS Feed
 by Calculated Risk on 5/31/2023 04:54:00 PM
Wednesday, May 31, 2023
Las Vegas April 2023: Visitor Traffic Down 4% Compared to 2019; Convention Traffic Down 30%
Note: I like using Las Vegas as a measure of recovery for both leisure (visitors) and business (conventions).
From the Las Vegas Visitor Authority: April 2023 Las Vegas Visitor Statistics
Las Vegas hosted approximately 3,385,500 visitors in Apr 2023, on par with the robust volumes achieved last Apr when pent‐up demand overtook receding pandemic impacts.
Overall hotel occupancy reached 84.3% for the month, similar to last Apr (+0.3 pts YoY). As Weekend occupancy (92.4%) saw a ‐0.8 pts YoY decline, Midweek occupancy approached 81%, surpassing last Apr by 1.5 pts.
Overall ADR reached $171, down 3.3% from Apr 2022 while RevPAR exceeded $144, ‐3.0% YoY.
 Click on graph for larger image.
 The first graph shows visitor traffic for 2019 (Black), 2020 (light blue), 2021 (purple), 2022 (orange), and 2023 (red).
Visitor traffic was down 4.4% compared to the same month in 2019.
Visitor traffic was up 0.1% compared to last April.
The second graph shows convention traffic.
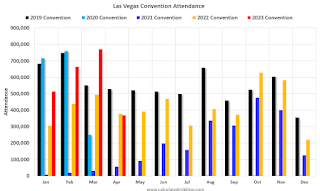
Convention traffic was down 30.2% compared to April 2019, and down 2.1% compared to April 2022.The second graph shows convention traffic.

Note: There was almost no convention traffic from April 2020 through May 2021.


