This article considers the research on trend-following rules when stock returns follow a two-state process.
- Valeriy Zakamulin and Javier Giner
- Optimal Trend Following Rules in Two-State Regime-Switching Models
- Working paper, University of Agder and University of La Laguna
- A version of this paper can be found here
What are the Motivations?
Academic research on trend-following investing has almost exclusively been focused on testing the profitability of various trading rules. Most of these rules are based on moving averages of past prices. The most popular is the Simple Moving Average (SMA). Less commonly used types of moving averages are the Linear Moving Average (LMA) and Exponential Moving Average (EMA). Each moving average is computed using an averaging window of a particular size. Besides, a trend-following rule can be based on either a single moving average or a combination of moving averages. For example, a moving average crossover is a rule constructed using two moving averages: one with short window size and another with long window size. There are SMA, LMA, and EMA crossovers. A popular Moving Average Convergence/Divergence (MACD) rule is based on three EMAs. Last but not least, there is a Momentum (MOM) rule that can also be considered as a specific moving average rule. However, all existing trend-following rules are ad-hoc rules whose optimality has never been justified theoretically.
What are the Research Questions?
The goal of our research is to examine the optimal trend-following rules when the stock returns follow a two-state process that randomly switches between bull and bear markets. A two-state regime-switching process is a widely accepted model for stock returns that can reproduce a number of stylized facts: fat tails, negative skewness, volatility clustering, short-term momentum, and medium-term mean reversion.
What are the Theoretical Findings?
First, we consider the case where the returns follow a Markov switching process. We show that in this case it is optimal to follow the trend using the EMA. A great advantage of a Markov switching model is its analytical tractability. However, this model oversimplifies the complexity of the real-life return process. In particular, a serious limitation of a Markov model is that the state termination probability does not depend on the time already spent in that state. In other words, there is no duration dependence. By contrast, many empirical studies document that the bull and bear states of the market exhibit positive duration dependence. A positive duration dependence means that the longer a bull (bear) market lasts, the higher its probability of ending.
Second, we consider the case where the returns follow a semi-Markov switching process where the stock market states exhibit positive duration dependence. A severe obstacle in this case is that a semi-Markov model lacks analytical tractability. Besides, all numerical computations rely on using complicated recursive algorithms. Our analysis relies on a semi-Markov model realized as an expanded-state Markov model suggested by Giner and Zakamulin (2021). This model allows some analytical tractability, and the numerical computations are of the same complexity as that of a conventional Markov model. Our results show that the optimal trend-following rule in a semi-Markov model is somewhat similar to the MACD rule.
Does the Empirical Evidence Support the Theoretical Results?
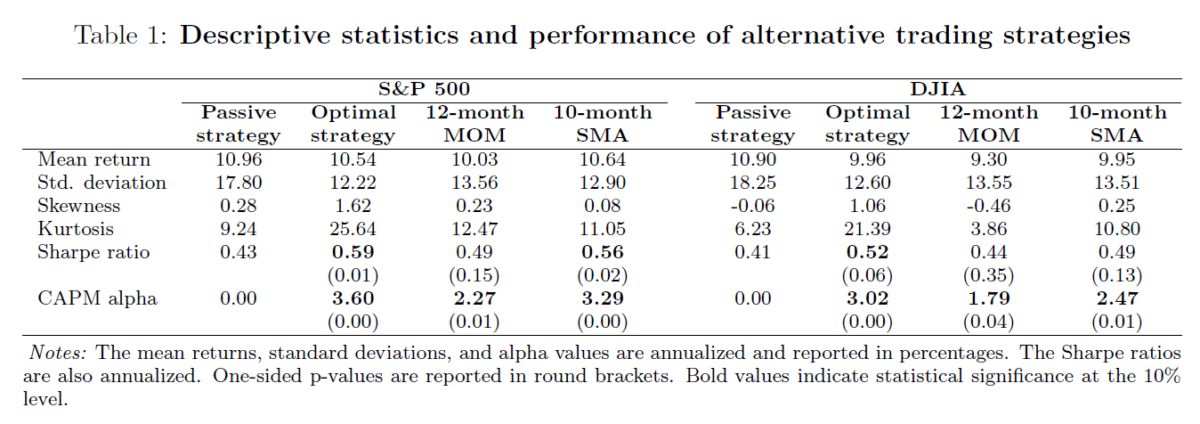
Yes, we demonstrate that our theoretical semi-Markov model is in good agreement with the empirical data, and our theoretically optimal trend-following rule outperforms the popular trend-following rules used by investment professionals and academics. In particular, in our empirical application, we start with fitting our semi-Markov model to the monthly returns of the S&P 500 and Dow Jones Industrial Average indices. Then we simulate the trend-following strategy using the theoretically optimal trading rule and demonstrate that the estimated performance of this strategy is better than that of the popular 10-month SMA rule and the 12-month MOM rule.
For each market index, the table below reports the descriptive statistics and performance of alternative trading strategies. Our main observations are as follows.
- First, regardless of the choice of a market index, all trend-following rules generate positive and statistically significant alpha.
- Second, all rules have an economically significantly higher Sharpe ratio than the buy-and-hold strategy. However, only the theoretically optimal rule has a Sharpe ratio that is statistically significantly higher than that of the buy-and-hold strategy regardless of the choice of a market index.
- Third, there are clear indications that the 10-month SMA rule outperforms the 12-month MOM rule, whereas the optimal rule outperforms both alternative trend-following rules. In particular, the theoretically optimal rule has a higher mean return, skewness, Sharpe ratio, and alpha than the SMA and MOM rules. Besides, the optimal rule has a lower standard deviation of returns than the SMA and MOM rules. However, the differences are relatively small and not statistically significant.
References
Giner and Zakamulin (2021), “Momentum and Mean Reversion in a Semi-Markov Model for Stock Returns”, working paper available at the SSRN

About the Author: Valeriy Zakamulin
—
Important Disclosures
For informational and educational purposes only and should not be construed as specific investment, accounting, legal, or tax advice. Certain information is deemed to be reliable, but its accuracy and completeness cannot be guaranteed. Third party information may become outdated or otherwise superseded without notice. Neither the Securities and Exchange Commission (SEC) nor any other federal or state agency has approved, determined the accuracy, or confirmed the adequacy of this article.
The views and opinions expressed herein are those of the author and do not necessarily reflect the views of Alpha Architect, its affiliates or its employees. Our full disclosures are available here. Definitions of common statistics used in our analysis are available here (towards the bottom).
Join thousands of other readers and subscribe to our blog.