Relative sentiment is an indicator that measures the positions, flows, and attitudes of institutional investors compared to those of individual investors–where institutions typically consist of large asset managers, insurance companies, pension funds, and endowments. In some instances, however–depending on the dataset and the asset class under consideration–institutions might also include hedge funds, CTAs, and other large speculators.
Recent studies(1)(2) have shown relative sentiment demonstrates statistically and economically significant predictive power across different regions, time periods, and datasets–even after adjusting for data-snooping.
Relative sentiment also appears to have the potential to identify better and worse performing assets along a cross-section and to provide more predictive information than either time-series momentum or time-series value.
It is natural, then, to ask whether relative sentiment constitutes a market anomaly, akin to how we view value, momentum, and other widely recognized investment factors.
Many studies have touched upon this question indirectly—without explicitly quantifying relative sentiment—by analyzing the behavior and outcomes of institutions and individuals separately. These studies tend to identify institutions as informed traders who achieve relatively beneficial outcomes in the financial markets while identifying individuals as “noise traders” who experience mostly unfavorable outcomes (a result many might find intuitive).
The conclusions of these studies appear to be robust. Whether one is looking at IPO data(3), trading data(4)(5), equity holdings(6)(7)(8), mutual fund flows(9)(10), or investors’ performance around earnings announcements(11), the results tend to show institutions attaining better outcomes than individuals.
While many of the aforementioned studies focus their analysis on either institutions or individuals, because of the “adding-up” constraint(12)–i.e., the so-called truism that when one class of investors is acting in one manner, investors not belonging to that class must be acting in the opposite manner–those studies are implicitly comparing one group of investors to everyone else and thus indirectly touching upon relative sentiment.
Over the past two decades, more direct relative sentiment studies have begun to appear. Again, the results appear to be robust: whether one is looking at the Fed Z.1 report(13), economic survey data(14), (15), equity holdings(16)(17), or the relative positioning of different investor classes in the derivatives markets(18),(19)(20), the results all point in the same direction–institutions outperform individuals.
The consistency of results for both direct and indirect relative sentiment across decades, datasets, and regions would appear to bolster relative sentiment’s case for anomaly status. Many other budding factors, however, have made similar claims ever since Fama and French published their 3-factor model in 1993(21).
Indeed, the proliferation of “factors” has become somewhat comical.
To make sense of it all, Hsu and Kalesnik in their 2014 white paper “Finding Smart Beta in the Factor Zoo”(22) put forward six criteria they believe a factor should meet before it can be considered a legitimate anomaly.
In what follows, we examine relative sentiment from the perspective of those six criteria in order to gauge how well relative sentiment measures up in its quest for anomaly status.
Hsu and Kalesnik’s Anomaly Criteria
- The factor exceeds a more stringent t-stat threshold of 3.5 (preferably 4.0) instead of 2.0 to adjust for data snooping and other biases:
Surveying the studies most closely related to relative sentiment that also report t-stats, we see multiple instances of t-stats near to or greater than the higher threshold that Hsu and Kalesnik prescribe.
Gibson and Safieddine (2003)(23) report t-stats as high as 9 for the difference in returns between the stocks institutions buy and the stocks they sell in any given quarter. Edelen et al.(24) report t-stats in the 9s for relative sentiment’s concurrent effect on equities and t-stats in the mid-2s for its predictive effect.
Schmeling (2007)(25) reports p-values that imply t-stats as high as 3 for the coefficients of individual sentiment on forward returns (when controlling for institutional sentiment).
Micaletti (2018)(26) reports an average t-stat of 3.75 across a range of relative sentiment parameter combinations (with t-stats of certain combinations exceeding 6).
In addition, both Micaletti (2018)(27) and Micaletti (2019)(28) find that a broad array of relative sentiment strategies exhibits extreme levels of statistical significance even after adjusting for data-snooping using multiple hypothesis testing techniques. Such techniques represent a much more stringent measure of statistical significance than a standalone t-stat threshold.
Thus, relative sentiment appears to have multiple examples in the literature of either generating extreme test statistics or (more notably) retaining extreme statistical significance after adjusting for data-snooping.
- The factor has a credible reason to offer a persistent premium:
Relative sentiment should offer a persistent premium for at least two deep-seated reasons.
First, institutions have enormous structural advantages over individuals:
- Better information: Institutions have superior information networks. For example, institutions have access to the levers of power–Congress, politicians, lobbyists, corporate CEOs, Fed governors, ex-Fed governors, etc. Someone, somewhere, always knows something and institutions tend to have better access to those in-the-know.
- Deeper pools of human capital: Each year financial institutions hire a new crop of MBAs, CFAs, and PhDs, all armed with the latest analytical techniques to help those institutions discern the state of corporate and economic fundamentals.
- Thought leadership: Institutions help craft the prevailing market narrative via their media appearances and research reports. How often does the world seem to be ending one day and then the next day the market gaps up 2% (trapping retail shorts) because of an overnight Goldman Sachs research report claiming things aren’t as bad as they seem…or some bellwether’s earnings will likely outperform expectations…or the Fed will turn dovish sooner than investors anticipate… or [insert some other explanation that only one day prior seemed impossible to fathom])?
These advantages are structural. It seems unlikely they will go away soon, if ever.
Second, individuals tend to succumb to cognitive biases that render them ripe for exploitation by institutions—e.g., extrapolating near-term trends into the distant future, cutting winners and selling losers, and so on.
For these two reasons, relative sentiment, in some form or another, seems likely to offer a persistent premium.
- The factor premium does not change materially due to minor variations in the factor definition or construction:
That direct and indirect relative sentiment have produced high significance across different datasets, time periods and regions, suggests it is extremely robust—not only to small changes in its definition or construction, but to large changes as well.
Indeed, Micaletti (2018)(29) and Micaletti (2019)(30) show that relative sentiment is robust to sizable changes in factor definition and to the learning method used to convert relative sentiment into tactical allocations, respectively.
- The factor works in non-U.S. countries and regions:
While most relative sentiment studies have dealt with U.S. data, several such studies have delivered solid evidence that relative sentiment also works elsewhere.
Schmeling (2007)(31) looks at the combined predictive power of institutional and individual standalone sentiment in three non-U.S. regions—Europe, Japan, and Asia ex-Japan—and finds significant predictive power in all three.
Micaletti (2019)(32) examines Schmeling’s data from the perspective of relative (rather than standalone) sentiment and reaches similar conclusions.
Grinblatt and Keloharju (2000)(33) find that foreign institutions outperform local individuals in Finland, while Bradrania et al. (2015)(34) report that foreign institutions gain from taking the opposite side of individuals’ trades in Australia.
Feng et al. (2014)(35) find that institutions in China skillfully time their mutual fund investments, while individuals reveal themselves to be “dumb money.”
Ryu et al. (2016)(36) report that in Korea institutional trades have a positive correlation with stock returns, while individual trades have a negative correlation.
Barber et al. (2009)(37) find that individual traders in Taiwan lose the equivalent of 2.2% of Taiwan’s GDP each year, while institutional investors gain 1.5%.
Thus, the predictive power of relative sentiment does not appear to be confined solely to the U.S. Indeed, it appears to work across a wide swath of both developed and emerging markets.
- The factor has been vetted, replicated and debated in top academic journals over decades:
The recognition that sentiment plays a role in market outcomes dates back several decades to some of the foundational papers on “Smart Money” and noise trader risk (Shleifer and Summers (1990)(38), Campbell and Kyle (1993)(39)).
Going back even further, Jensen talks about “mass-money” institutions exploiting “dumb money” retail traders in Stock Market Blueprints(40) (an out-of-print classic that my father, a retail trader himself, just happened to have a copy of).
Indirect relative sentiment studies date back more than two decades (e.g., Barber and Odean (2000)(41), Bange (2000)(42), Grinblatt and Keloharju (2000)(43)), while more direct studies date back a similar amount of time (e.g., Gibson and Safieddine (2003)(44)).
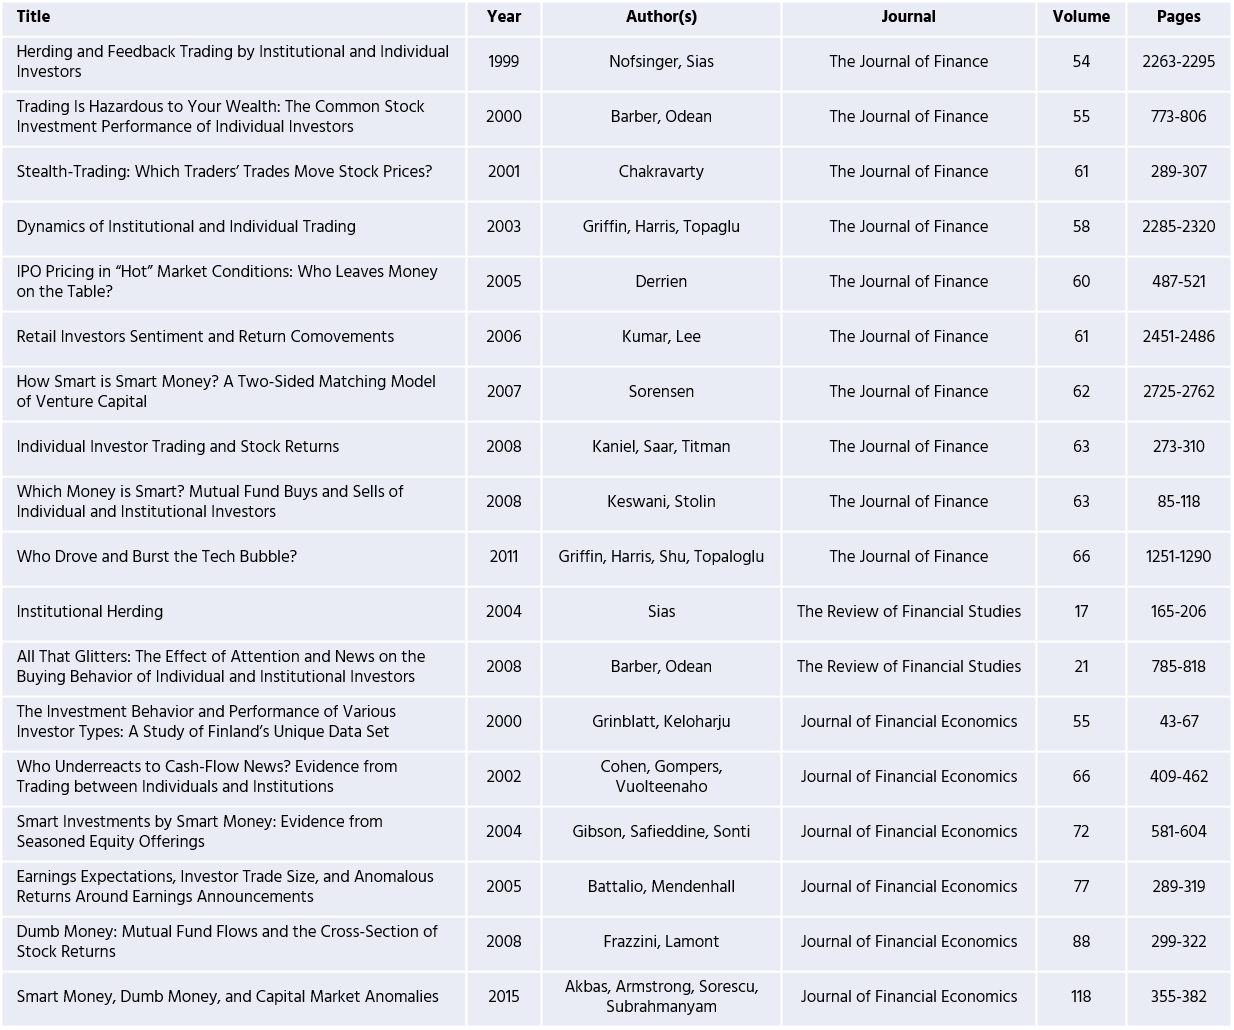
With respect to top academic journals, the following table lists studies related to relative sentiment that have appeared over the past several decades in either The Journal of Finance, The Review of Financial Studies, or the Journal of Financial Economics (ranked as the top three finance journals, respectively, by Scimago):
- The factor was discovered many years ago, has survived numerous database revisions and extensive out-of-sample data:
The steady accumulation of direct and indirect relative sentiment studies across different datasets, factor definitions, and time periods, suggests relative sentiment, as a meta-factor, has been around for quite some time (perhaps since the dawn of markets?) and that it has worked out-of-sample.
Consequently, relative sentiment does not appear to be dependent on any particular database or method of quantification.
With respect to out-of-sample results, this blogpost examines the out-of-sample performance of the strategies in Micaletti (2019)(45), finding that the out-of-sample performance is consistent with the in-sample performance across the paper’s four original metrics.
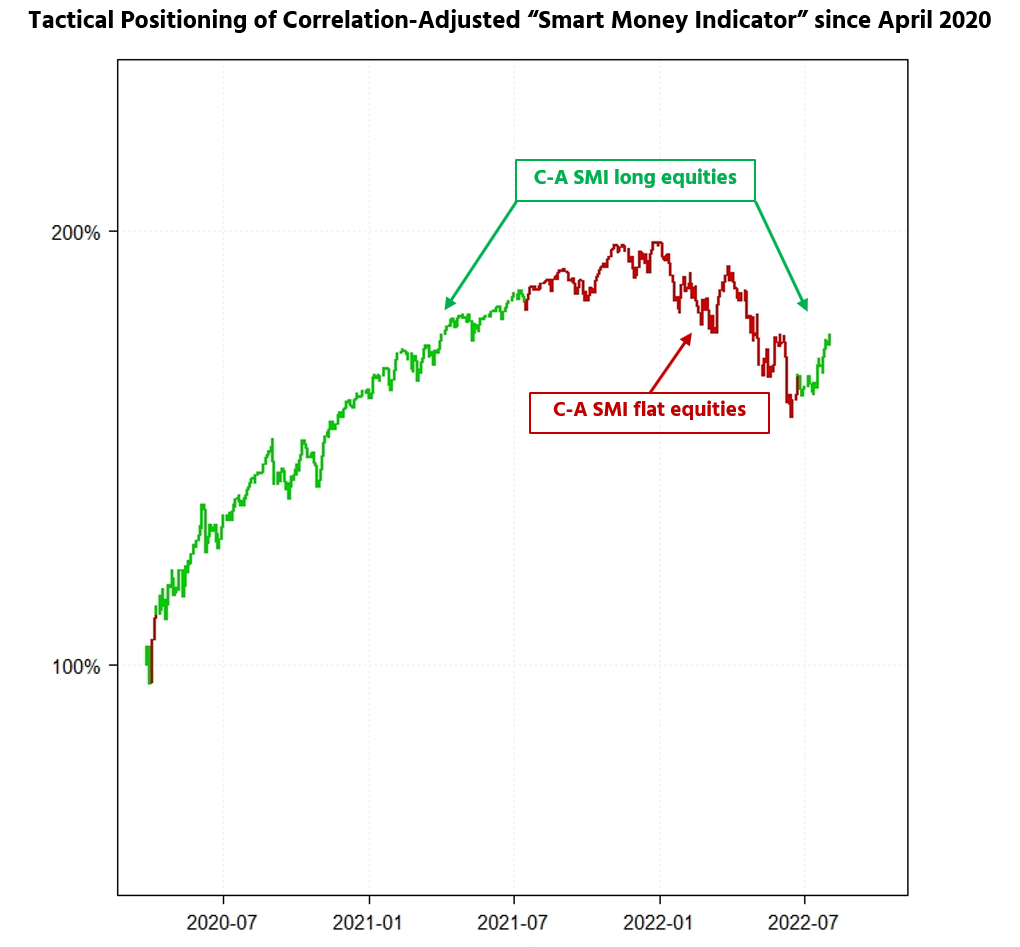
This blogpost touches on the tactical allocation strategy in Micaletti (2018)(46), finding that the original formulation performed well out-of-sample pre-COVID, and that when adjusted for the structural change in the equity-bond correlation observed post-March 2020 has continued to deliver effective tactical signals as illustrated in the following chart.
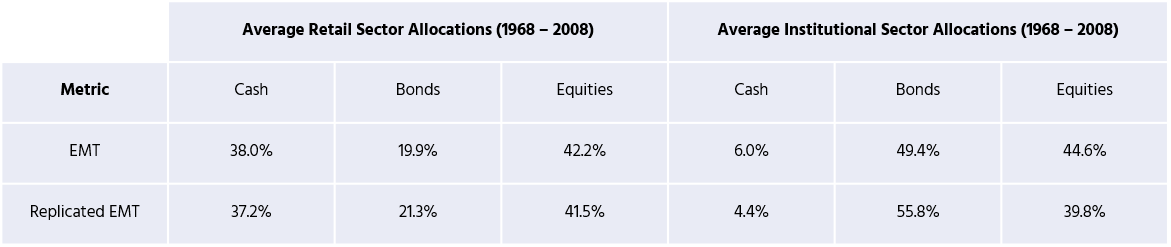
Edelen, Marcus, and Tehranian (“EMT”) in their paper Relative Sentiment and Stock Returns (2010)(47), look at Fed Z.1 data over the time period 1968 – 2008 to construct a metric that measures the fraction of retail wealth invested in equities relative to the fraction of total wealth invested in equities.
Using the ex-post distribution of their metric, they determine the 25th and 75th percentiles and find that when the metric is above (below) the 75th (25th) percentile, equities have lower (higher) returns in the subsequent quarter. That is, equities perform worse on average when retail is more bullish than institutions–as the logic underlying relative sentiment would predict.
We have attempted to replicate EMT’s analysis to see how the indicator has performed since 2008. While EMT provide a moderately detailed roadmap of how to construct their indicator, some information is missing and has to be inferred. Nonetheless, the average allocations to equities, bonds, and cash of our replicated metric for both retail and institutions correspond well to the averages reported by EMT.
Moreover, rather than using hindsight to determine high or low levels of the indicator, we simply use 1 as our cutoff. An indicator value above (below) 1 signifies that retail is more (less) bullish equities relative to institutions.
The following table shows the in-sample (1968-2008) and out-of-sample (2009-2022) results of our replicated metric using 1 as the cutoff level. (Note: the Fed Z.1 data comes out with a one-quarter lag, so we looked at the indicator with no lag and with a one-quarter lag.)
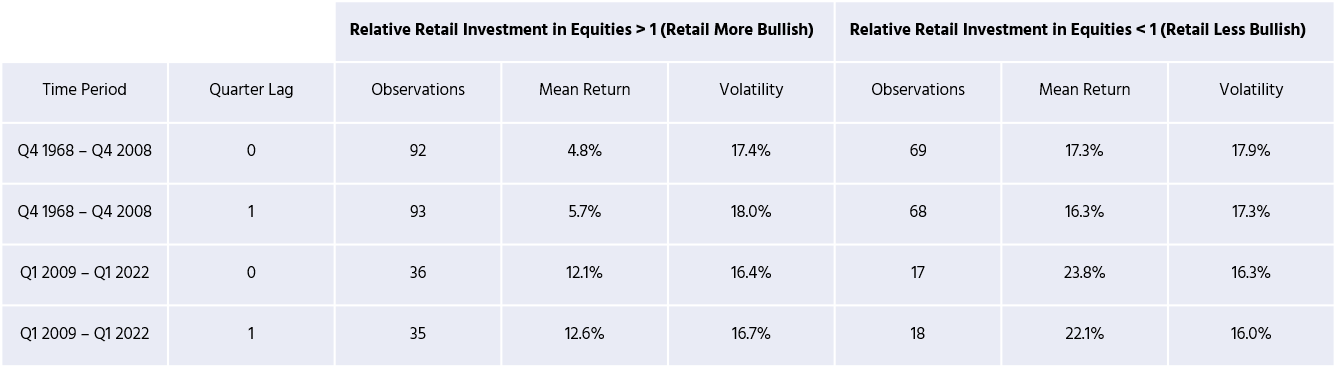
As one can see, the annualized average quarterly returns are higher with the same level of volatility when institutions are more bullish equities relative to retail (i.e., the EMT indicator is less than 1). The results hold both in an out-of-sample.
Further note that not only does this replication exercise add to relative sentiment’s out-of-sample oeuvre, it also adds evidence that relative sentiment is robust to minor changes in its definition. For despite the fact our replicated metric was not 100% in alignment with EMT’s original metric, the nature of our results matched those of EMT.
Conclusion
When examined under the lens of Hsu and Kalesnik’s factor criteria, relative sentiment appears to make a respectable case for anomaly status.
It has extreme test statistics, structural reasons for offering a persistent premium, considerable robustness to changes in factor definition, ample evidence it works for non-U.S. regions, and has been vetted by top academic journals over several decades. It has also worked out-of-sample across a variety of datasets, regions, and market environments.
Moreover, on a time-series basis, relative sentiment provides more predictive information than either value or momentum–further strengthening its anomaly credentials. (And note that both value and momentum were embraced as anomalies within two decades of their respective seminal works.)
Ultimately, however, a factor’s anomaly status is never quite fixed. Some factors long-considered anomalies have had their anomaly status called into question in recent years (e.g., the size premium), often sparking intense debate.
Thus, while relative sentiment’s underlying concept–i.e., the notion that institutions tend to outperform individuals–may have already attained widespread acceptance given its generally self-evident nature, whether any particular implementation of relative sentiment will continue to presage persistent premia remains an open question.
But, then again, such is the case with every other factor. Reach out if you have any questions — ask for Ray.

References[+]
| ↑1 | Micaletti, Raymond, 2018, Want smart beta? follow the smart money: Market and factor timing using relative sentiment, SSRN Electronic Journal, URL: https://ssrn.com/abstract=3164081. |
|---|---|
| ↑2 | Micaletti, Raymond, 2019, Relative Sentiment and Machine Learning for Tactical Asset Allocation, SSRN Electronic Journal, URL: https://ssrn.com/abstract=3475258. |
| ↑3 | Derrien, Francois, 2005, IPO Pricing in “Hot” Market Conditions: Who Leaves Money on the Table, The Journal of Finance, 60, 487-521. |
| ↑4 | Barber, Brad M. and Odean, Terrance, 2000, All That Glitters: The Effect of Attention and News on the Buying Behavior of Individual and Institutional Investors, The Review of Financial Studies, 21, 785-818. |
| ↑5 | Chakravarty, Sugato, 2001, Stealth-Trading: Which Traders’ Trades Move Stock Prices, Journal of Financial Economics, 61, 289-307. |
| ↑6 | Grinblatt, Mark and Keloharju, Matti, 2000, The investment behavior and performance of various investor types: a study of Finland’s unique data set, Journal of Financial Economics, 55, 43-67. |
| ↑7 | Bange, Mary M., 2000, Do the Portfolios of Small Investors Reflect Positive Feedback Trading?, The Journal of Financial and Quantitative Analysis, 35, 239-255. |
| ↑8 | Sias, Richard W., Starks, Laura T., and Titman, Sheridan, 2006, Changes in Institutional Ownership and Stock Returns: Assessment and Methodology, The Journal of Business, 79, 2869-2910. |
| ↑9 | Frazzini, Andrea and Lamont, Owen, Dumb Money: Mutual Fund Flows and the Cross-Section of Stock Returns, Journal of Financial Economics, 88, 299-322. |
| ↑10 | Feng, Xunan, and Zhou, Mingshan, and Chan, Kam C., 2014, Smart Money or Dumb Money? A Study on the Selection Ability of Mutual Fund Investors in China, The North American Journal of Economics and Finance, 30, 154-170. |
| ↑11 | Cohen, Randolph B., Gompers, Paul A., and Vuolteenaho, Tuomo, 2002, Who underreacts to cash-flow news? Evidence from trading between individuals and institutions, Journal of Financial Economics, 66, 409-462. |
| ↑12 | Grinblatt, Mark and Keloharju, Matti, 2000, The investment behavior and performance of various investor types: a study of Finland’s unique data set, Journal of Financial Economics, 55, 43-67. |
| ↑13 | Edelen, Roger M., Marcus, Alan J., and Tehranian, Hassan, 2010, Relative Sentiment and Stock Returns, Financial Analysts Journal, 66, 20-32. |
| ↑14 | Schmeling, Maik, 2007, Institutional and Individual Sentiment: Smart Money and Noise Trader Risk?, International Journal of Forecasting, 23, 127-145. |
| ↑15 | Micaletti, Raymond, 2019, Relative Sentiment and Machine Learning for Tactical Asset Allocation, SSRN Electronic Journal, URL: https://ssrn.com/abstract=3475258. |
| ↑16 | Nofsinger, John R. and Sias, Richard W., 1999, Herding and Feedback Trading by Institutional and Individual Investors, The Journal of Finance, 54, 2263-2295. |
| ↑17 | Gibson, Scott and Safieddine, Assem, 2003, Does Smart Money Move Markets, The Journal of Portfolio Management, 29, 66-77. |
| ↑18 | Basu, Devraj, Oomen, Roel, and Stremme, Alexander, 2006, Exploiting the Informational Content of the Linkages between Spot and Derivatives Markets, 2006, url: https://www2.warwick.ac.uk/fac/soc/wbs/subjects/finance/research/wpaperseries/wf06-249.pdf. |
| ↑19 | Basu, Devraj, Oomen, Roel C.A., and Stremme, Alexander, 2010, How to Time the Commodity Market, Journal of Derivatives & Hedge Funds, 16, 1-8. |
| ↑20 | Micaletti, Raymond, 2018, Want smart beta? follow the smart money: Market and factor timing using relative sentiment, SSRN Electronic Journal, URL: https://ssrn.com/abstract=3164081. |
| ↑21 | Fama, Eugene F. and French, Kenneth R., 1993, Common Risk Factors in the Returns on Stocks and Bonds, Journal of Financial Economics, 33, 3-56. |
| ↑22 | Hsu, Jason and Kalesnik, Vitali, 2014, Finding Smart Beta in the Factor Zoo, Research Affiliates White Paper. |
| ↑23 | Gibson, Scott and Safieddine, Assem, 2003, Does Smart Money Move Markets, The Journal of Portfolio Management, 29, 66-77. |
| ↑24 | Edelen, Roger M., Marcus, Alan J., and Tehranian, Hassan, 2010, Relative Sentiment and Stock Returns, Financial Analysts Journal, 66, 20-32. |
| ↑25 | Schmeling, Maik, 2007, Institutional and Individual Sentiment: Smart Money and Noise Trader Risk?, International Journal of Forecasting, 23, 127-145. |
| ↑26 | Micaletti, Raymond, 2018, Want smart beta? follow the smart money: Market and factor timing using relative sentiment, SSRN Electronic Journal, URL: https://ssrn.com/abstract=3164081. |
| ↑27 | Micaletti, Raymond, 2018, Want smart beta? follow the smart money: Market and factor timing using relative sentiment, SSRN Electronic Journal, URL: https://ssrn.com/abstract=3164081. |
| ↑28 | Micaletti, Raymond, 2019, Relative Sentiment and Machine Learning for Tactical Asset Allocation, SSRN Electronic Journal, URL: https://ssrn.com/abstract=3475258. |
| ↑29 | Micaletti, Raymond, 2018, Want smart beta? follow the smart money: Market and factor timing using relative sentiment, SSRN Electronic Journal, URL: https://ssrn.com/abstract=3164081. |
| ↑30 | Micaletti, Raymond, 2019, Relative Sentiment and Machine Learning for Tactical Asset Allocation, SSRN Electronic Journal, URL: https://ssrn.com/abstract=3475258. |
| ↑31 | Schmeling, Maik, 2007, Institutional and Individual Sentiment: Smart Money and Noise Trader Risk?, International Journal of Forecasting, 23, 127-145. |
| ↑32 | Micaletti, Raymond, 2019, Relative Sentiment and Machine Learning for Tactical Asset Allocation, SSRN Electronic Journal, URL: https://ssrn.com/abstract=3475258. |
| ↑33 | Grinblatt, Mark and Keloharju, Matti, 2000, The investment behavior and performance of various investor types: a study of Finland’s unique data set, Journal of Financial Economics, 55, 43-67. |
| ↑34 | Bradrania, Reza and Grant, Andrew R. and Westerholm, P. Joakim and Wu, Wei, Fool’s Mate: What Does CHESS Tell Us About Individual Investor Trading Performance? (August 24, 2015). CIFR Paper No. 80/2015 |
| ↑35 | Feng, Xunan, and Zhou, Mingshan, and Chan, Kam C., 2014, Smart Money or Dumb Money? A Study on the Selection Ability of Mutual Fund Investors in China, The North American Journal of Economics and Finance, 30, 154-170. |
| ↑36 | Ryu, Doojin, Kim, Hyeyoen, and Yang, Heejin, 2017, Investor sentiment, trading behavior, and stock returns, Applied Economic Letters, 24, 826-830 |
| ↑37 | Barber, Brad M., Lee Y-Tsung, Liu, Yu-Jane, and Odean, Terrance, 2008, Just How Much Do Individual Investors Lose by Trading?, The Review of Financial Studies, 22, 609-632. |
| ↑38 | Shleifer, Andrei and Summers, Lawrence H., 1990, The Noise Trader Approach to Finance, Journal of Economic Perspectives, 4, 19-33. |
| ↑39 | Campbell, John Y. and Kyle, Albert S., 1993, Smart Money, Noise Trading and Stock Price Behaviour, Review of Economic Studies, 60, 1-34. |
| ↑40 | Jensen, Edward M., 1967, Stock Market Blueprints, Strother. |
| ↑41 | Barber, Brad M. and Odean, Terrance, 2000, All That Glitters: The Effect of Attention and News on the Buying Behavior of Individual and Institutional Investors, The Review of Financial Studies, 21, 785-818. |
| ↑42 | Bange, Mary M., 2000, Do the Portfolios of Small Investors Reflect Positive Feedback Trading?, The Journal of Financial and Quantitative Analysis, 35, 239-255. |
| ↑43 | Grinblatt, Mark and Keloharju, Matti, 2000, The investment behavior and performance of various investor types: a study of Finland’s unique data set, Journal of Financial Economics, 55, 43-67. |
| ↑44 | Gibson, Scott and Safieddine, Assem, 2003, Does Smart Money Move Markets, The Journal of Portfolio Management, 29, 66-77. |
| ↑45 | Micaletti, Raymond, 2019, Relative Sentiment and Machine Learning for Tactical Asset Allocation, SSRN Electronic Journal, URL: https://ssrn.com/abstract=3475258. |
| ↑46 | Micaletti, Raymond, 2018, Want smart beta? follow the smart money: Market and factor timing using relative sentiment, SSRN Electronic Journal, URL: https://ssrn.com/abstract=3164081. |
| ↑47 | Edelen, Roger M., Marcus, Alan J., and Tehranian, Hassan, 2010, Relative Sentiment and Stock Returns, Financial Analysts Journal, 66, 20-32. |
About the Author: Raymond Micaletti
—
Important Disclosures
For informational and educational purposes only and should not be construed as specific investment, accounting, legal, or tax advice. Certain information is deemed to be reliable, but its accuracy and completeness cannot be guaranteed. Third party information may become outdated or otherwise superseded without notice. Neither the Securities and Exchange Commission (SEC) nor any other federal or state agency has approved, determined the accuracy, or confirmed the adequacy of this article.
The views and opinions expressed herein are those of the author and do not necessarily reflect the views of Alpha Architect, its affiliates or its employees. Our full disclosures are available here. Definitions of common statistics used in our analysis are available here (towards the bottom).
Join thousands of other readers and subscribe to our blog.