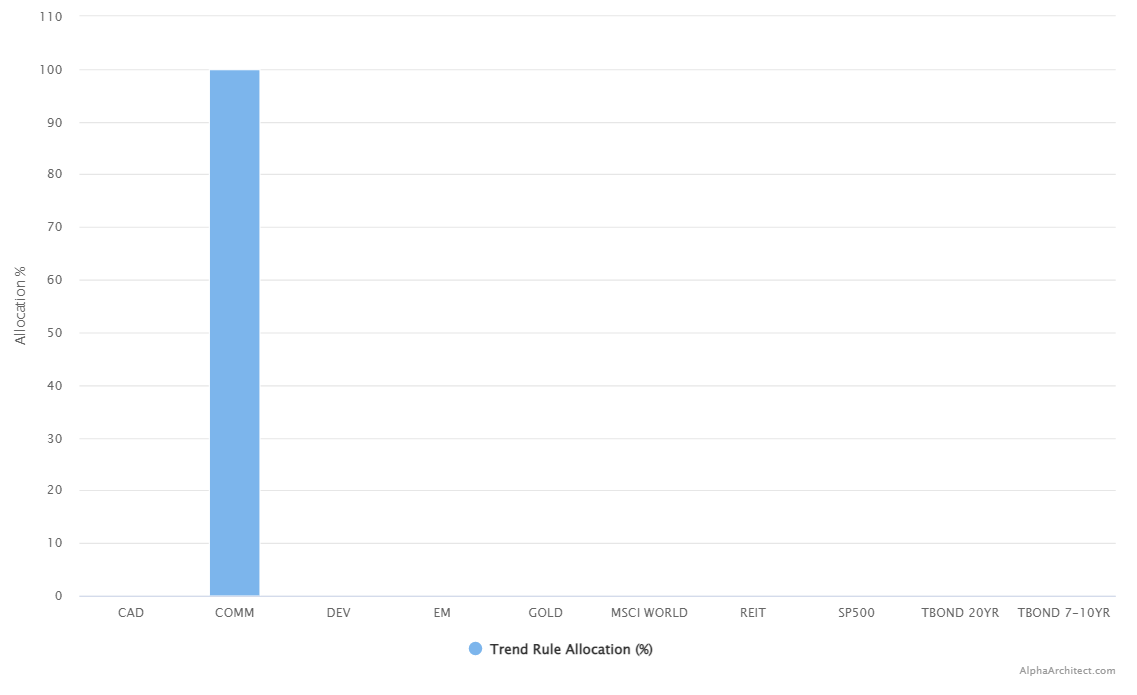
Just recently we posted the trend-following weights for our Robust Asset Allocation model. Something interesting happened — the model suggested zero exposure to every asset, except commodities(1)
My knee-jerk reaction was, “Wow, never seen that before.”
But as is the case with all emotional reactions, it is important to not lean on them too much, and instead, we need to look at the data.
Have Commodities Ever Been the Only Game in Town, Historically?
For this analysis, we wanted to get a broad sample that goes back further than the standard 90s+ range. In order to facilitate this analysis, we focused on what is called the “IVY 5”,(2)
The five core asset classes are as follows:
- US Stocks= SP500 Total Return Index
- Int’l Stocks= MSCI EAFE Total Return Index
- REIT= FTSE NAREIT All Equity REITS Total Return Index
- Comm.= Goldman Sachs Commodity Index (GSCI) Index
- Bonds= Merrill Lynch 7-10 year Government Bond Index
Next, we deploy several long-term trend following rules on each of these asset classes from 1971 to July 2022.(3)
The below highlights the trend-followed exposures to the IVY 5 assets (assuming each are a 20% allocation).
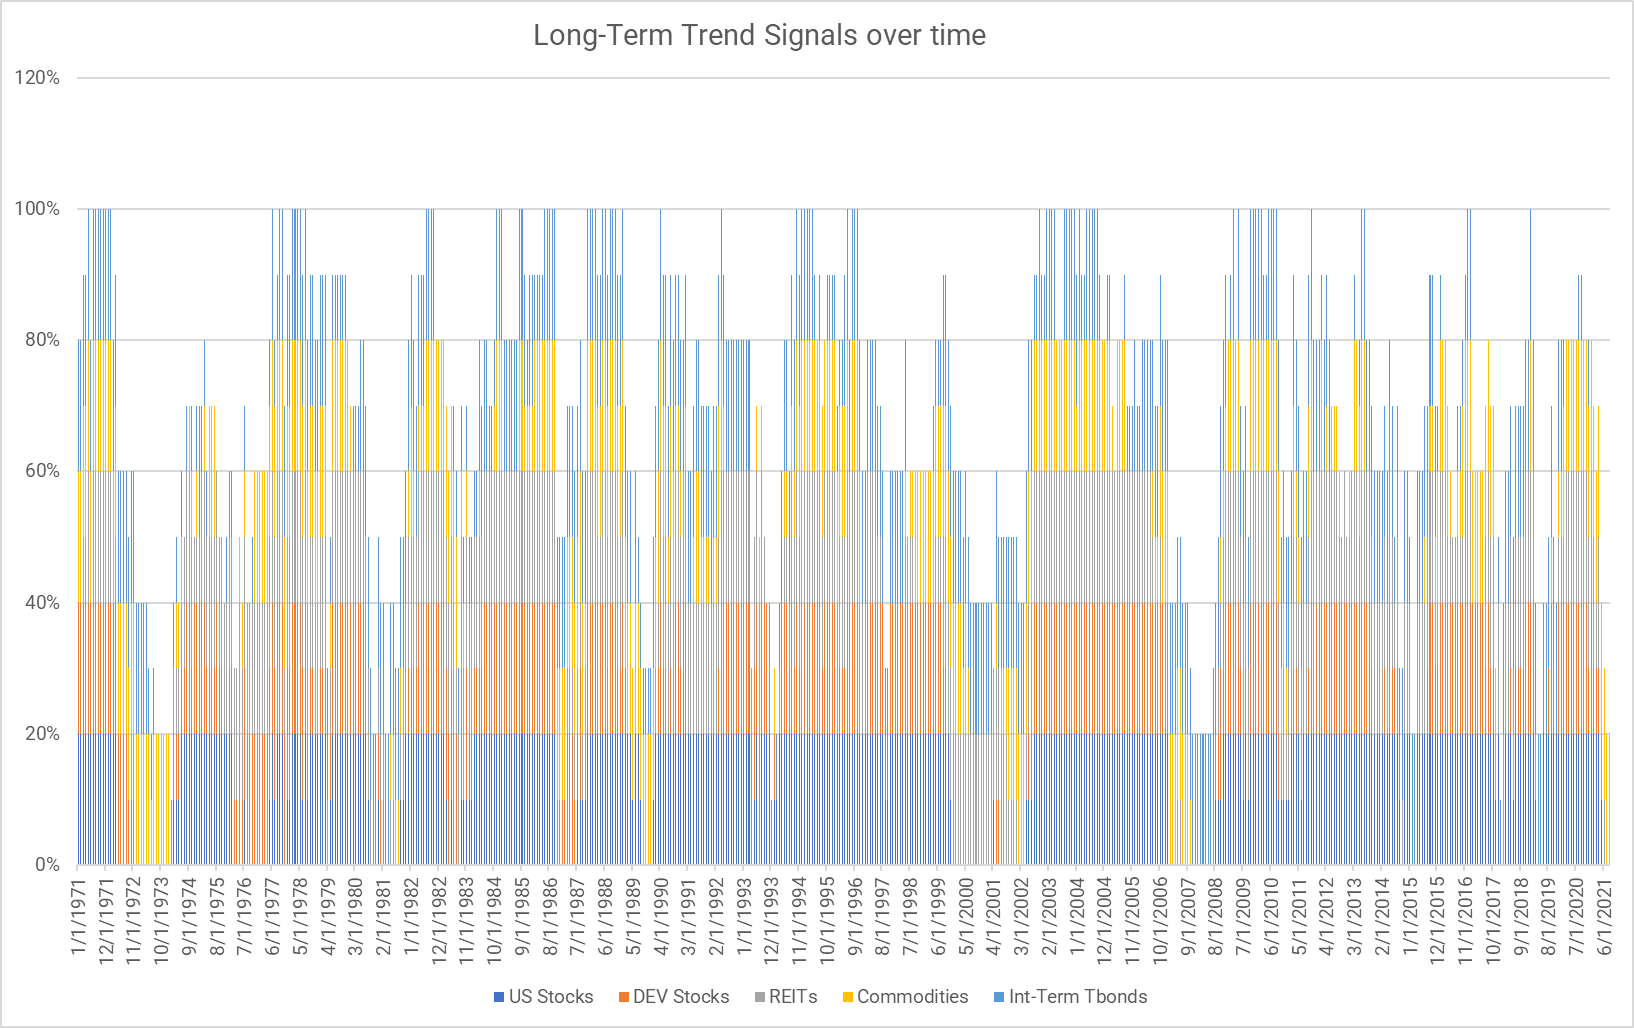
Visually, you might be able to make out the episodes when commodities are long and everything else is bombed out. But here is a breakdown of the historical monthly signals when commodities are the only game in town. Aside from the past 2 months, the only historical time when this occurred was during the 1973 oil crisis.
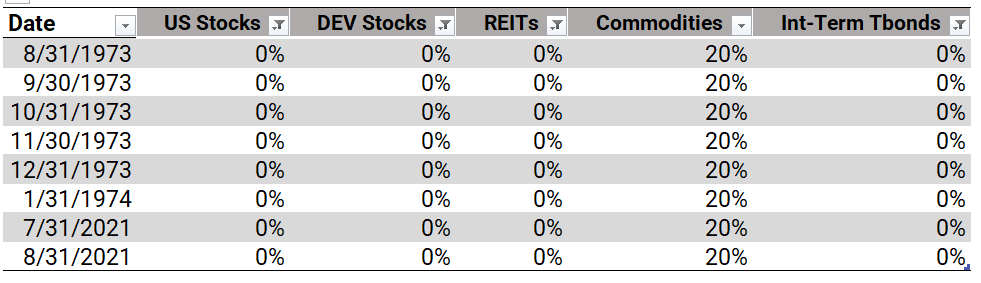
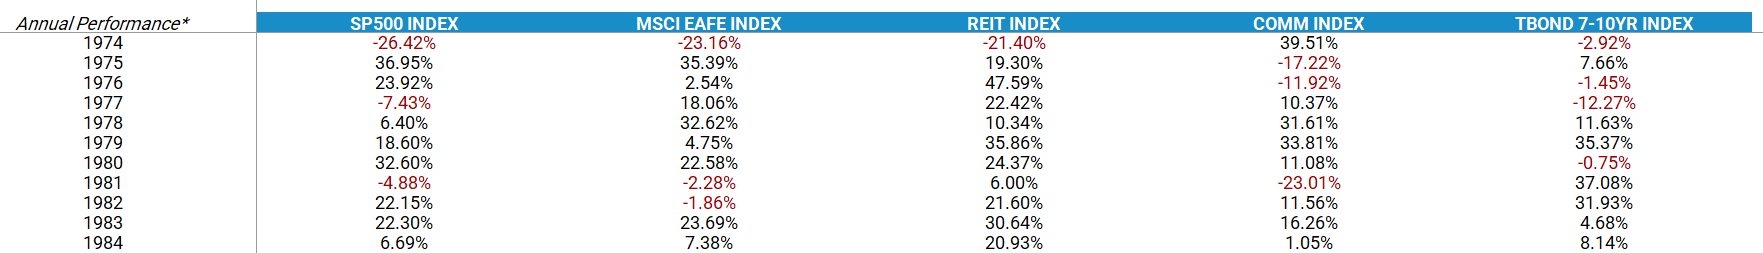
The weaponization of oil production leads to big positive movements in commodities and fear in all other asset classes. Market performance through 1974 was really bad, but longer-term, market performance was decent (at least in nominal terms!).
Other Interesting Observations
Since we had the data handy, we decided to look at some of the other interesting patterns in the data.
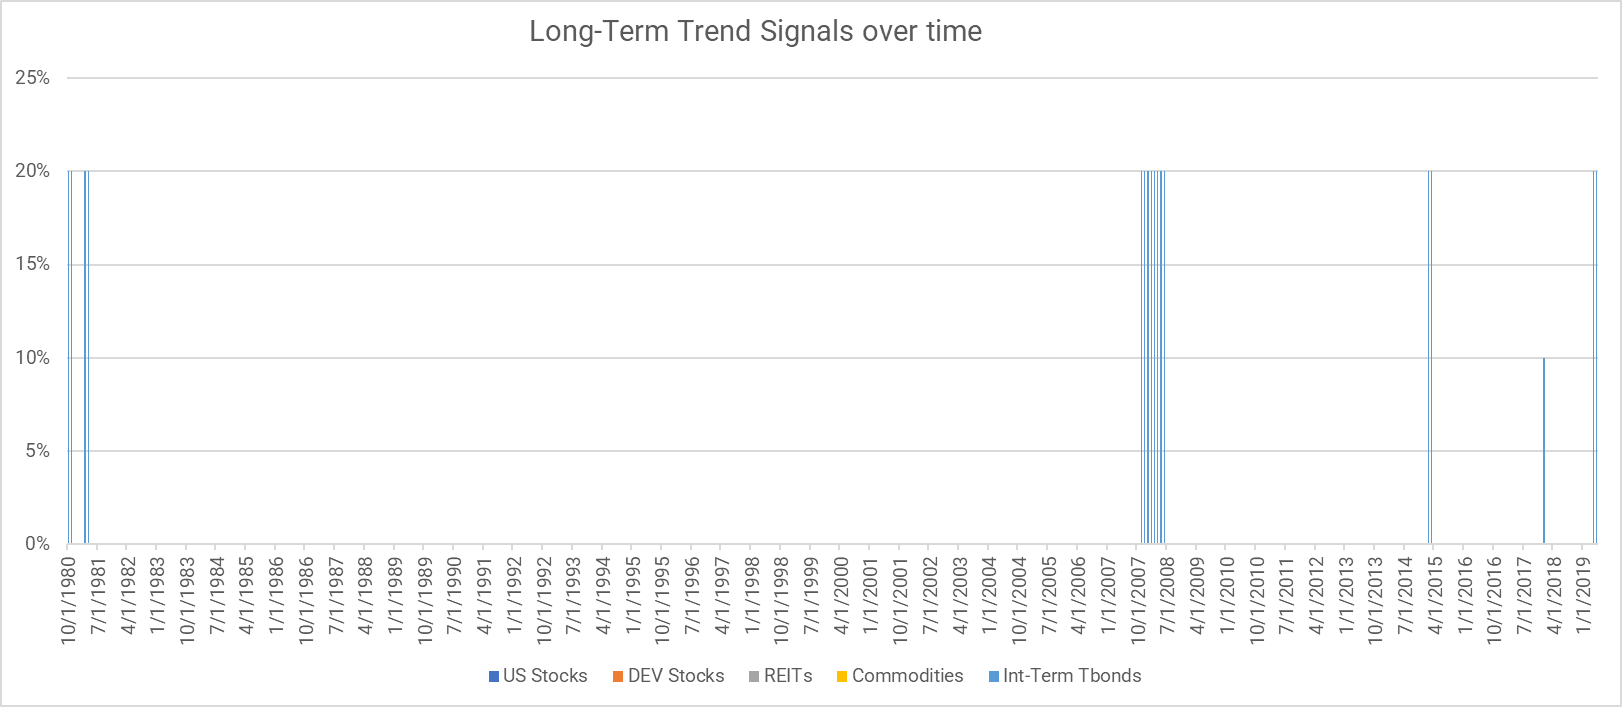
Out of curiosity, we plotted the months when treasury bonds were the trending asset and all others were negative. Interestingly enough, most of these events are in the post-2007 period. This would also explain why many tactical allocation models, that rely on more recent data, generally use bonds as their ‘risk-off’ asset.
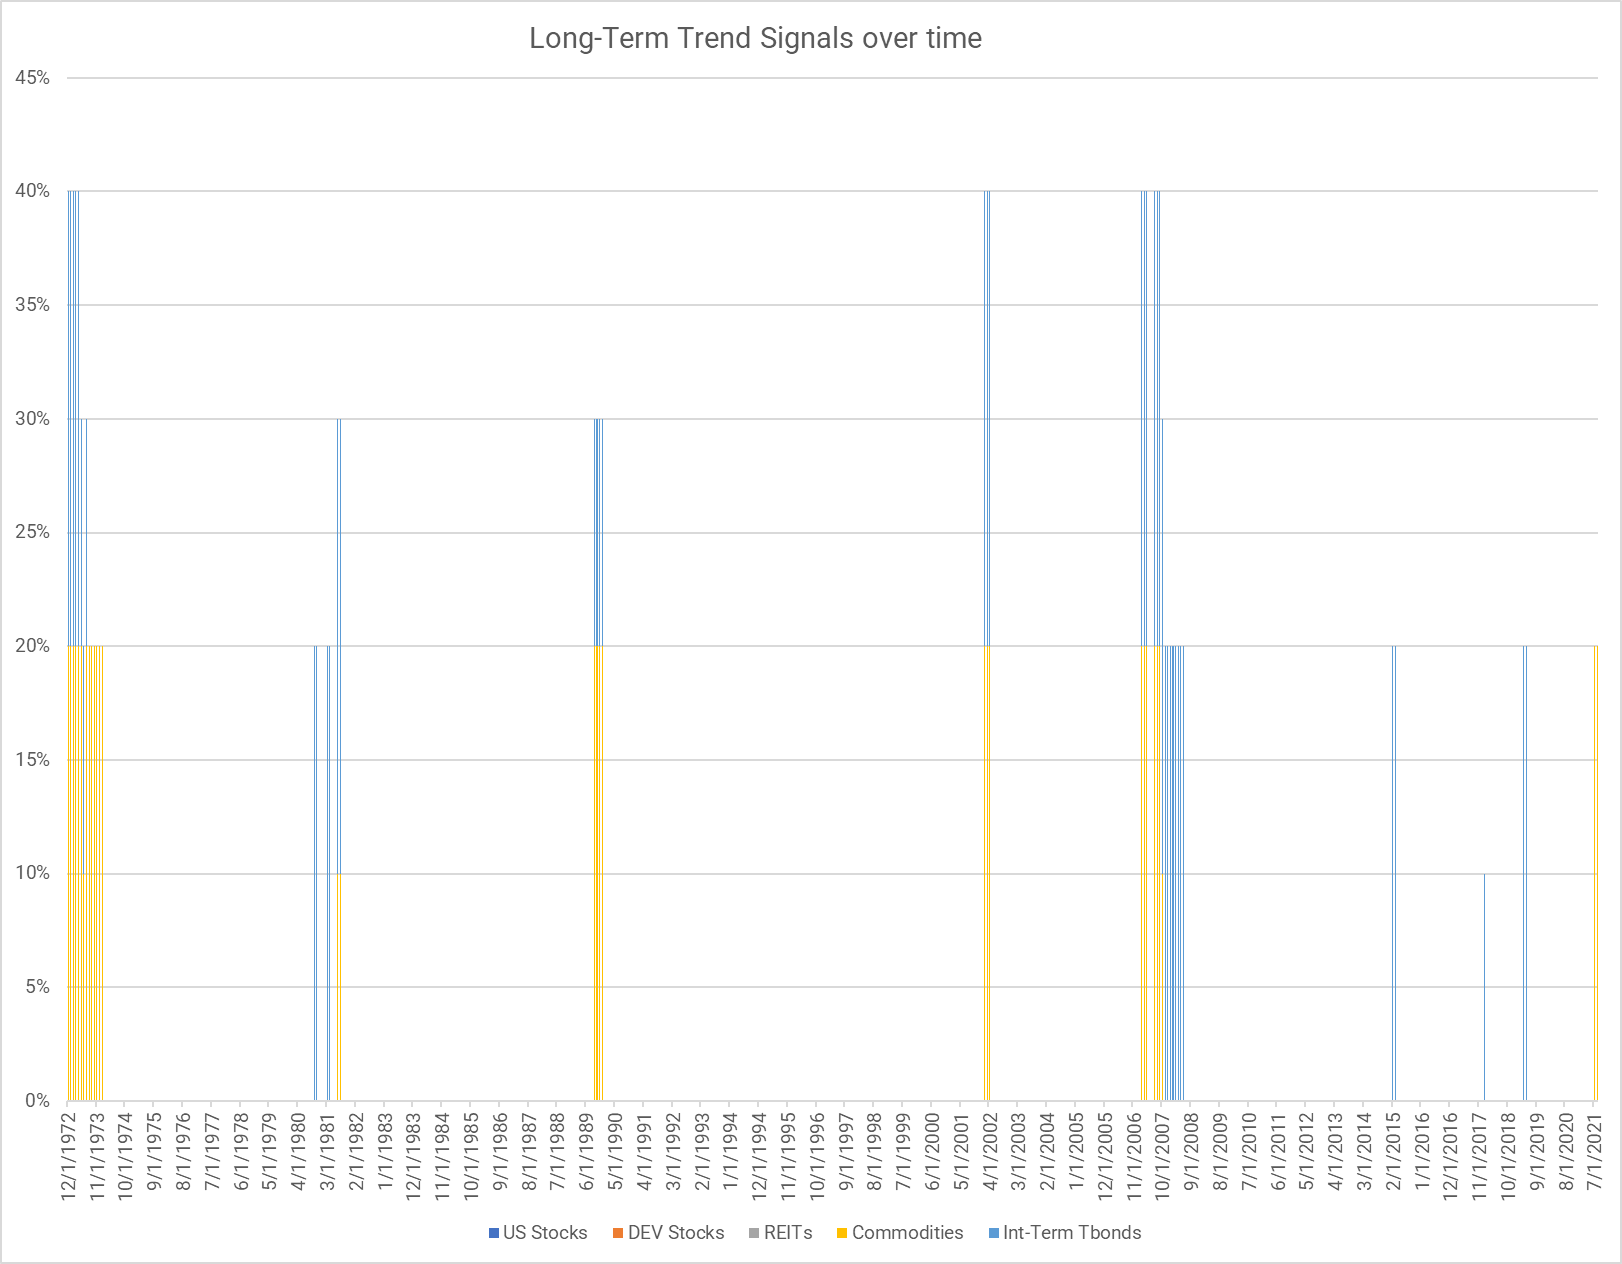
Here is a look at months when either commodities or bonds are in play, but stocks and reits are busted:
Why do we care?
The analysis above highlights that we are in a rare regime when commodities are the only long asset with a positive trend. The last time this happened we entered a long period of high inflation and poor real returns. Will this happen again? Who knows. But we do know that post-1973 we entered a world where, for several decades (at least up to around 2007), both bonds and commodities were an important component of a diversified portfolio. The recent past has arguably made investors complacent in their reliance on a stock/bond portfolio as an end-all-be-all solution. When history tells us that incorporating commodities into a portfolio probably makes sense from a diversification standpoint.
Stay diversified!

References[+]
| ↑1 | Trend Calculations:
CAD = Canadian Equities We examine two trend-following signals (MOM and MA) and take an average of the rules (ROBUST)
Robust: Average of Rule #1 and Rule #2
Trend Allocations:
|
|---|---|
| ↑2 | described by Faber (2007) and then further elaborated by Faber and Richardson (2009), is a great example of this approach. The authors highlight that the largest endowments have highly complex portfolios that extend well beyond the 60/40 benchmark with respect to their levels of complexity. Nonetheless, the performance of a simple endowment replication model, consisting of five core asset classes, does a pretty reasonable job at capturing their performance. |
| ↑3 | The application of simple moving average rules has been demonstrated to protect investors from large market drawdowns, which is defined as the peak-to-trough decline experienced by an investor. For example, Jeremy Siegel, in his book, Stocks for the Long Run, explores the effect on performance on the Dow Jones Industrial Average from 1886 to 2006, when applying a 200-day moving average rule. Applying the rule is straightforward. If the market is above the 200-day moving average rule, hold, otherwise, go to cash. Siegel found that this simple technical rule outperforms a buy-and-hold approach, both in absolute terms and on a risk-adjusted basis. Meb also highlights similar results in his paper on the subject of long-term moving averages.
We’ve conducted a similar analysis on the US stock market from 1801 to 2015 and found that trend-following rules applied on the generic stock market have been effective at minimizing tail risk events. We’ve extended the analysis to every asset class where we could get our hands on the numbers and investigated the results. Same conclusion: trend-following minimizes tail risk. The figure below outlines the trend-following approach, visually.  The details of the rules are as follows: 1. Time Series Momentum Rule (TMOM) This rule is meant to avoid assets with poor absolute performance.
2. Simple Moving Average Rule (MA) This rule is meant to avoid assets with poor trending performance.
TMOM and MA rules are highly correlated but there are circumstances where the rules have a difference of opinion. |
About the Author: Wesley Gray, PhD
—
Important Disclosures
For informational and educational purposes only and should not be construed as specific investment, accounting, legal, or tax advice. Certain information is deemed to be reliable, but its accuracy and completeness cannot be guaranteed. Third party information may become outdated or otherwise superseded without notice. Neither the Securities and Exchange Commission (SEC) nor any other federal or state agency has approved, determined the accuracy, or confirmed the adequacy of this article.
The views and opinions expressed herein are those of the author and do not necessarily reflect the views of Alpha Architect, its affiliates or its employees. Our full disclosures are available here. Definitions of common statistics used in our analysis are available here (towards the bottom).
Join thousands of other readers and subscribe to our blog.