In our last installment, we reviewed the performance–across four regions–of a machine-learning-based Sentix relative sentiment model for tactical asset allocation. The regions included: the USA, Europe, Japan, and Asia ex-Japan (referred to as USA, EUR, JPN, and AEJ, respectively, in the charts and tables below).
The SSRN paper (written in October 2019) that introduced the model showed results from 2002 (the inception of the dataset) up to September 30, 2019.
Because the model incorporated combinatorial cross-validation (CCV), the resulting backtests reported in the paper were essentially “out-of-sample,” by virtue of the nature of CCV–as they were constructed by chronologically splicing the performance of “test set” forecasts (i.e., forecasts made on segments of data unseen by the model during its training phase).
Nonetheless, we will refer to the performance of the model up to September 30, 2019 as “in-sample,” in order to contrast it with the truly out-of-sample, walk-forward results generated from October 2019 to June 2022.
For ease of exposition, we will refer to the Sentix relative sentiment machine learning model as “RSML,” which stands for “relative sentiment machine learning.”
In our prior article, we also drew a comparison between RSML and a simple (non-machine learning) Sentix relative sentiment strategy, which we will henceforth refer to as “SSS,” which stands for “simple Sentix strategy.”
We will look at the four metrics contained in the original paper and in our recent review, namely:
- Statistical significance: The level of broad-based statistical significance in each region when adjusted for data-snooping
- Economic significance: The economic significance in each region when compared to several different benchmark strategies
- Relative sentiment vs. momentum: The performance of regional equity markets conditioned on both the state of relative sentiment and the state of time-series momentum
- Relative sentiment along the cross-section: The cross-sectional performance of regional equity markets conditioned on the rank-order of relative sentiment
Executive Summary
The out-of-sample RSML performance from October 2019 onward was consistent with its in-sample performance across all metrics–strengthening the results of the original paper and bolstering the case that relative sentiment is a market anomaly.
Meanwhile, the SSS demonstrated strong out-of-sample performance in both economic terms and relative to momentum, but poor out-of-sample performance along the cross-section. The SSS was aided by nearly-binary (100% or 0%) equity allocations at opportune times during both the post-COVID rally (April 2020 – Dec 2021) and the 2022 first-half selloff.
Statistical Significance
The tables below show the (average) number of RSML strategies in each region that pass the multiple-hypothesis-testing (MHT) “reality check” at different levels of “significance” when we apply those tests as-of the cutoff dates for the in-sample and out-of-sample data(1). (Recall that α values less than 0.30 are considered conservative(2).)
(Note: For each region, we average the number of significant strategies across various parametrizations of three different MHT algorithms.)
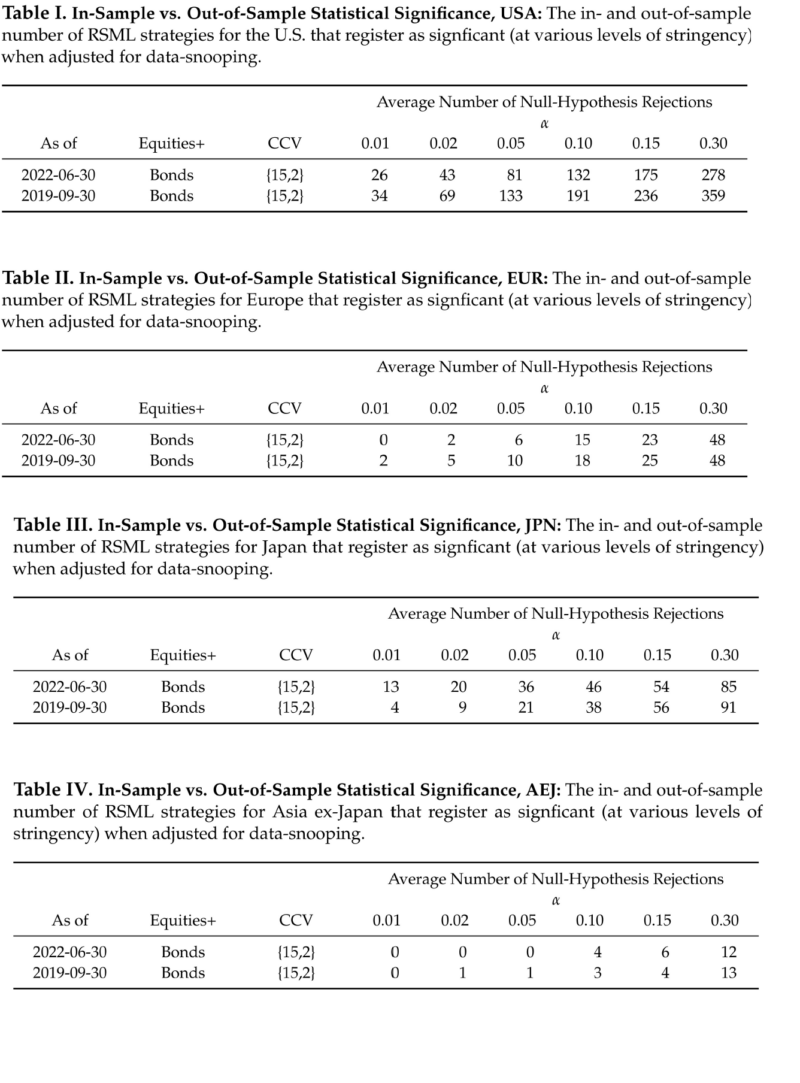
In general, the breadth of statistical significance out-of-sample is comparable to the in-sample breadth for most regions. Once again, the U.S. had the most strategies, at all levels, that registered as significant out-of-sample, although the total number was down about 22% from the in-sample number. At the low end about 28% of all U.S. strategies registered as significant out-of-sample (vs. 36% in-sample). At the high end, 2.6% of U.S. strategies registered as significant (vs. 3.4% in-sample).
In Europe, the total out-of-sample number of significant strategies (48) exactly matched the in-sample number, and the numbers at more stringent levels of significance were roughly comparable (e.g., 15 vs. 18 at α = 0.10).
In Japan, slightly fewer strategies were significant overall (85 vs. 91), while the ones that were significant often exhibited much higher levels of significance. For example, 13 Japan RSML strategies now register at the most stringent level of significance (α = 0.01) compared to only 4 in-sample.
In Asia ex-Japan, the total number of significant strategies out-of-sample was comparable to the in-sample number (12 vs. 13), and the numbers at higher levels of significance were also roughly comparable.
Thus, while the out-of-sample breadth of statistical significance for U.S. strategies moderated somewhat from its exceptionally high in-sample starting point, the other regions generally maintained the same breadth of significance. Notably, Japan substantially increased the intensity of its significance (i.e., it registered a greater number of significant strategies at higher levels of stringency than it did before).
Economic Significance
In the original paper, we compared the performance of equity/bond and equity/cash strategies to benchmarks whose equity allocations were set (with perfect foresight) based on the average equity allocations of the RSML strategies across the entire in-sample period.
For example, if the average monthly RSML equity allocation was 73%, the benchmarks’ equity allocations were also set to 73% (rebalanced monthly).
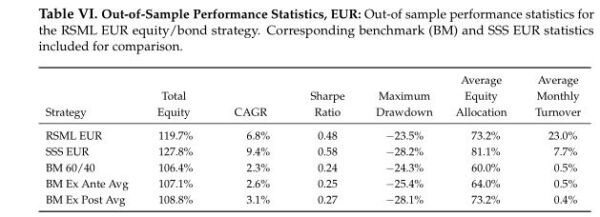
Here we compare the out-of-sample performance (October 2019 – June 2022) of the regional RSML equity/bond strategies to three different benchmarks:
- A 60/40 equity/bond strategy
- An equity/bond strategy where the equity allocation equals the in-sample average RSML equity allocation (i.e., the average RSML equity allocation up to September 2019)
- An equity/bond strategy where the equity allocation equals the out-of-sample average RSML equity allocation (i.e., the average RSML equity allocation from October 2019 onward–this strategy would have required perfect foresight)
The out-of-sample RSML performance includes a full day’s lag between month-end model calibration and the rebalancing of the RSML strategy for the upcoming month (that is, we train the model using month-end data and make any subsequent trades at the close of the first trading day of the new month). In addition to a day’s lag, we also incorporate four basis points of detrimental slippage relative to the closing price when rebalancing.
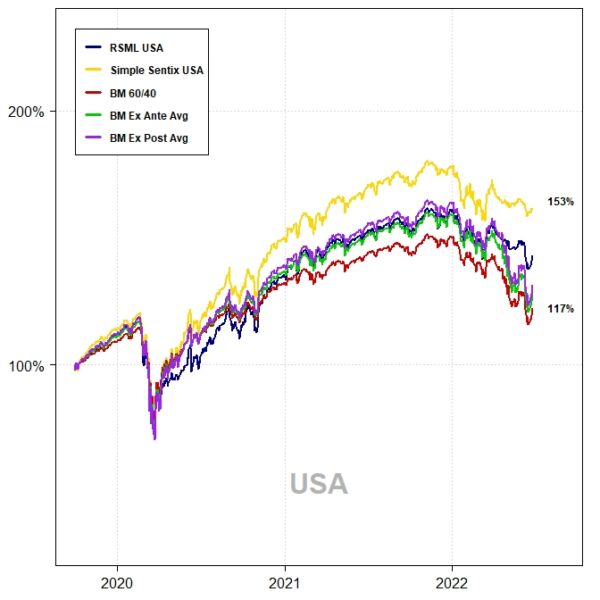
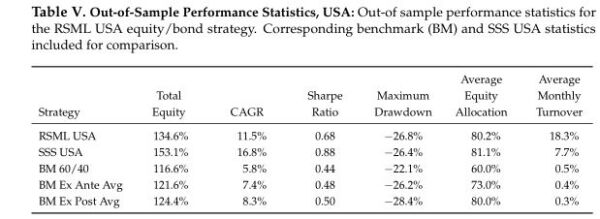
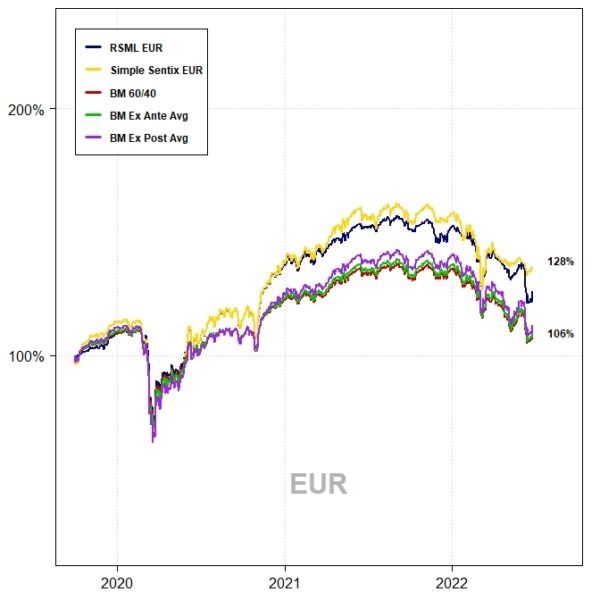
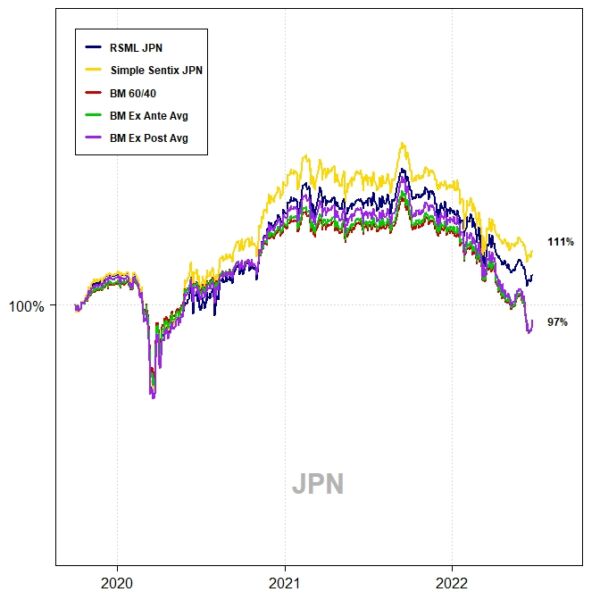
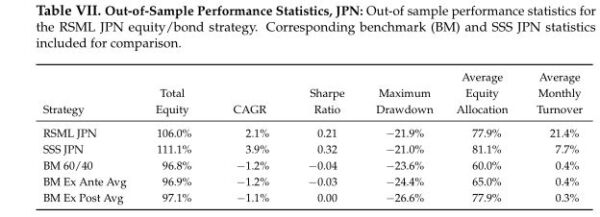
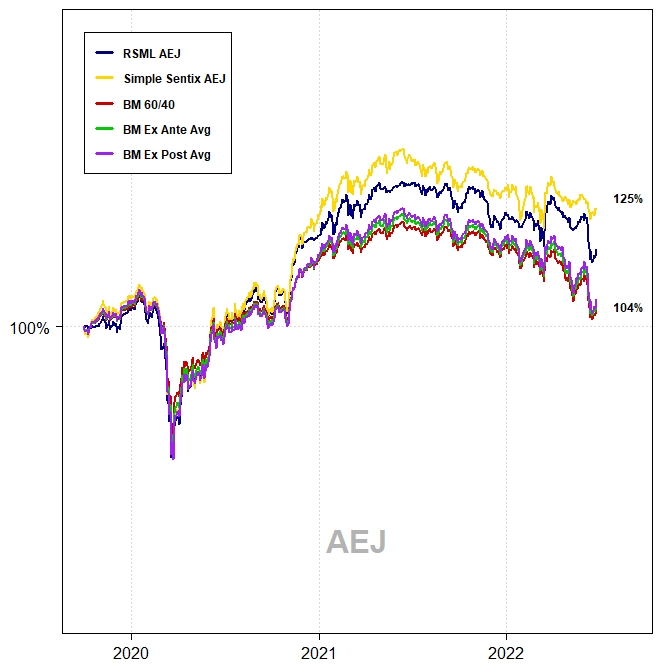
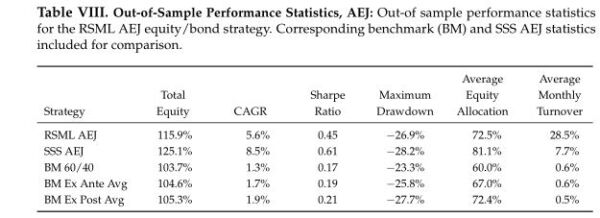
The out-of-sample performance of each region–from October 2019 to June 2022–is shown in the charts and tables below. This represents 33 months of out-of-sample data.
The RSML strategies outperformed all benchmarks in each region, with compound annualized rates of relative outperformance ranging from 2.9 percentage points (relative to a perfect foresight benchmark) to 5.3 percentage points (relative to a 60/40).
In the U.S., RSML performed out-of-sample at the 43rd percentile of its in-sample 33-month relative return distribution (relative to a 60/40). RSML EUR performed at the 50th percentile; RSML JPN at the 30th percentile; and RSML AEJ at the 45th percentile.
Notably, the SSS performed the best in all regions. As mentioned above, it was greatly aided by moving to a 100% equity allocation for most of 2020-2021 and then quickly downshifting to 0%-25% during 2022 (whereas the RSML strategies were less binary, but directionally similar).
USA
EUROPE
Japan
Asia ex-Japan
Relative Sentiment vs. Time-Series Momentum
As in the original paper, we condition the monthly regional equity returns on the state of the region’s relative sentiment and time-series momentum at the end of the prior month. This leads to quadrants, defined by whether relative sentiment and momentum are, respectively, positive or negative.
We consider relative sentiment in a region to be “positive” (“negative”) if the RSML’s forecasted equity allocation for the upcoming month is greater (less) than the time-weighted average equity allocation up to that point in time.
For example, if for the U.S., the historical average RSML equity allocation up to a given point in time were 73% and the upcoming month’s forecasted equity allocation were 63%, we would consider relative sentiment to be negative for the upcoming month.
We measure time-series momentum using both the trailing 12-month return and the 10-month simple moving average for a region.
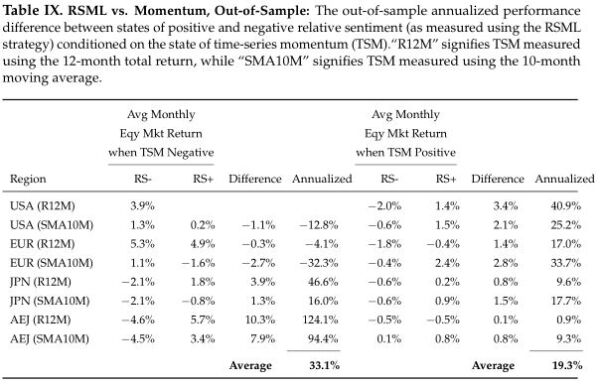
With only 33 out-of-sample data points, some quadrants had few or no observations. (The quadrant with the most observations was the “positive relative sentiment/positive momentum” quadrant.) But, for the most part, the quadrants that did have observations generated results largely consistent with the in-sample performance.
In the case of RSML strategies, for the in-sample data, the average annualized (monthly) return differentials (across all regions) between positive and negative relative sentiment when momentum was negative was 49.7%. For the out-of-sample data, it was 33.1%. That is, the combination of negative momentum/positive relative sentiment produced higher returns than the combination of negative momentum/negative relative sentiment.
Likewise, for the in-sample data, the average annualized return differentials (across all regions) between positive and negative relative sentiment when momentum was positive was 22.3%. For the out-of-sample data, it was 19.3%.
In other words, regardless of the state of time-series momentum, positive relative sentiment presaged higher returns compared to negative relative sentiment. Consequently, knowing the state of relative sentiment provided more predictive information than knowing the state of time-series momentum.
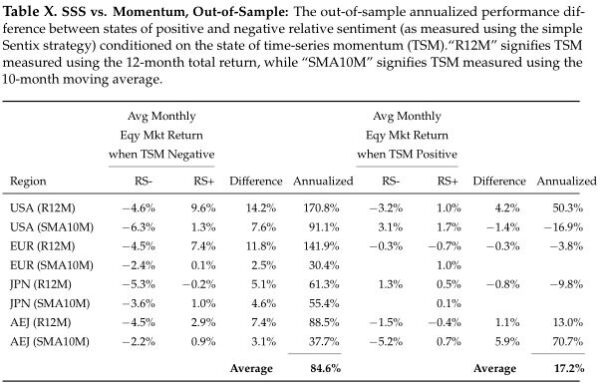
Notably, the SSS strategies performed particularly well on this metric when time-series momentum was negative:
Relative Sentiment Along the Cross-Section
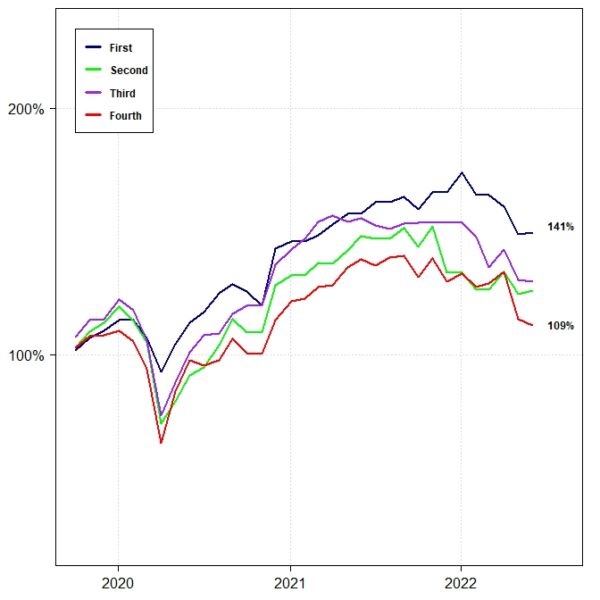
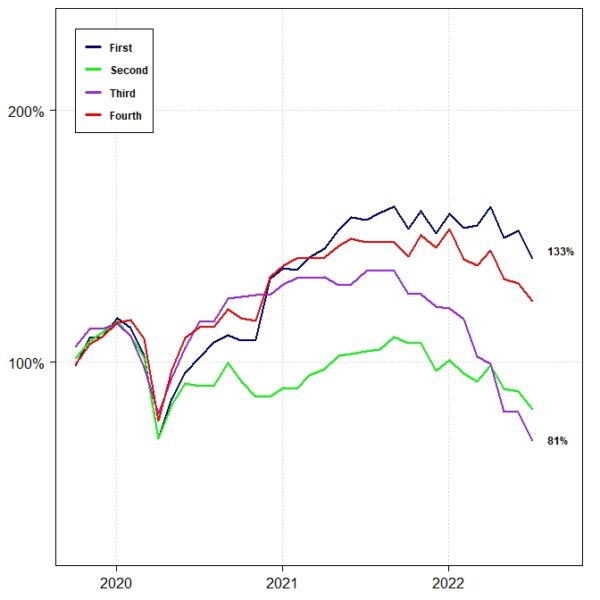
At the beginning of each month, on a walk-forward basis, we lined up the forecasted RSML equity allocations for the upcoming month for each region and ranked them. We assigned the regions to different strategies based on their ranks, from “First” to “Fourth.”
For example, the “First” strategy repeatedly held the region that had the highest-ranked equity allocation for the upcoming month, while the “Fourth” strategy held the region with the lowest-ranked equity allocation. We then compiled the returns for each strategy accordingly.
During the in-sample period, the relative performance of those four strategies was a function of their rank-order. The “First” strategy had the best performance, while the “Fourth” strategy had (by far) the worst performance.
The out-of-sample RSML results generally maintained that same relative-ranking characteristic, as the chart below shows. The “First” strategy had the highest out-of-sample return, while the “Fourth” strategy had the lowest. The “Second” and “Third” strategies delivered similar returns in the middle.
The results are hypothetical results and are NOT an indicator of future results and do NOT represent returns that any investor actually attained. Indexes are unmanaged and do not reflect management or trading fees, and one cannot invest directly in an index.
Unlike with the prior two metrics, the SSS did not perform well cross-sectionally (here we ranked the magnitudes of the regional Sentix relative sentiment indices at each point in time):
The results are hypothetical results and are NOT an indicator of future results and do NOT represent returns that any investor actually attained. Indexes are unmanaged and do not reflect management or trading fees, and one cannot invest directly in an index.
While the SSS “First” strategy did finish first, the “Fourth” strategy finished second and was significantly higher than either the “Second” or “Third” strategies. This result suggests the RSML models are uncovering cross-regional relationships that the SSS models, by virtue of their simplicity, are incapable of identifying(3).
Summary
The out-of-sample performance of the RSML strategies–from October 2019 until June 2022–was consistent with their in-sample performance across all four metrics.
- Statistical significance: The breadth of statistical significance remained largely the same across regions with the exception of the U.S., which had 22% fewer strategies of significance out-of-sample–but still had, by far, the greatest number of significant strategies. Japan increased the intensity of its statistical significance (i.e., it had more strategies registering significance at higher levels of stringency). Europe and Asia ex-Japan remained largely unchanged from the in-sample performance.
- Economic significance: The out-of-sample performance of the RSML strategies, with the exception of Japan, landed between the 40th and 50th percentiles of their in-sample relative return distributions (relative to a 60/40 benchmark). Japan finished at the 30th percentile. Compared to benchmarks that could have been known in advance (i.e., “BM 60/40” and “BM Ex Ante”), the RSML strategies outperformed on a compound relative basis by 330 to 530 basis points per annum (with rebalancing lags and slippage included).
- Versus Momentum: The out-of-sample performance of the RSML strategies relative to time-series momentum was also consistent with their in-sample performance, despite some quadrants having relatively few observations. Knowing the state of relative sentiment provided more predictive information than knowing the state of time-series momentum.
- Along the Cross-Section: The out-of-sample relative performance along the regional cross-section largely played out as a function of the rank-order of relative sentiment–i.e., the highest-ranked regions had the cumulative best performance, while the lowest-ranked regions had the cumulative worst performance, with the mid-ranked regions delivering results in between.
Further, the out-of-sample results for the simple Sentix strategies demonstrate that even simple applications of relative sentiment may be useful.
Taken together, both the in- and out-of-sample RSML results suggest that the relative sentiment between institutional and individual investors has multi-faceted predictive power–whether used on a standalone basis within regions, compared to time-series momentum, or as a measure of relative returns along the cross-section.
In the larger picture, these results are simply another entry in the long line of academic and practitioner research that shows institutions tend to outperform individuals in the financial markets–a notion most investors might intuitively feel makes sense.
Relative sentiment simply takes that institutional-individual dynamic and makes it actionable–by measuring the positions, flows, or attitudes of institutions relative to individuals and aligning one’s allocations accordingly.

References[+]
| ↑1 | That is, for the “June 30, 2022” results, we performed multiple hypothesis testing on strategy backtests generated by the combinatorial cross-validation/machine learning procedure applied to the entire dataset (2002- June 2022). Whereas in the original paper, that process was applied using data up to September 30, 2019. |
|---|---|
| ↑2 | López de Prado, Marcos, and Michael J. Lewis, 2018, What is the optimal significance level for investment strategies?, SSRN Electronic Journal, URL: https://ssrn.com/abstract=3193697. |
| ↑3 | To put this in perspective, we calibrate each regional RSML model independently, using the region’s historical returns and the relative sentiment values from the other four regions. Then, when we line up the forecasted equity allocations from those independently-calibrated models, the rank-order of those forecasts appears to be predictive of forward relative returns–despite those forecasts having been made by different combinations of input predictors and different machine learning algorithms with different parametrizations! Moreover, we find that on a month-by-month basis, the actual rank of a region’s forward return often differs from the predicted rank by no more than one ranking value. For example, regions predicted to have the highest return generally have the highest or second highest return over the next month. Regions predicted to have the second highest return generally finish with the first, second, or third highest return (but not the fourth, which is two ranking spots away), and so on…. |
About the Author: Raymond Micaletti
—
Important Disclosures
For informational and educational purposes only and should not be construed as specific investment, accounting, legal, or tax advice. Certain information is deemed to be reliable, but its accuracy and completeness cannot be guaranteed. Third party information may become outdated or otherwise superseded without notice. Neither the Securities and Exchange Commission (SEC) nor any other federal or state agency has approved, determined the accuracy, or confirmed the adequacy of this article.
The views and opinions expressed herein are those of the author and do not necessarily reflect the views of Alpha Architect, its affiliates or its employees. Our full disclosures are available here. Definitions of common statistics used in our analysis are available here (towards the bottom).
Join thousands of other readers and subscribe to our blog.