Despite 5% short-term interest rates and stickier inflation than some people would like and the Fed potentially pushing back interest rate cuts for a few months and the new True Detective seasons being a massive disappointment…the S&P 500 continues to take out new all-time highs.
By my count there have already been a baker’s dozen in 2024 alone.1
Here are the new highs by year since 2015:
- 2015: 10
- 2016: 18
- 2017: 62
- 2018: 18
- 2019: 35
- 2020: 32
- 2021: 70
- 2022: 1
- 2023: 0
- 2024: 13
That’s nearly 260 new highs over the past 10 years or so. Not bad at all.
Of course, if we extend this back a little longer there was an extended stretch of no new highs following the Great Financial Crisis.
The S&P 500 peaked in October of 2007, bottomed in March of 2009 and didn’t reach new highs again until March of 2013. That means no new all-time highs for five-and-a-half years.
The stock market can be feast or famine.
Returns from the bottom in March of 2009 are otherworldly at this point:
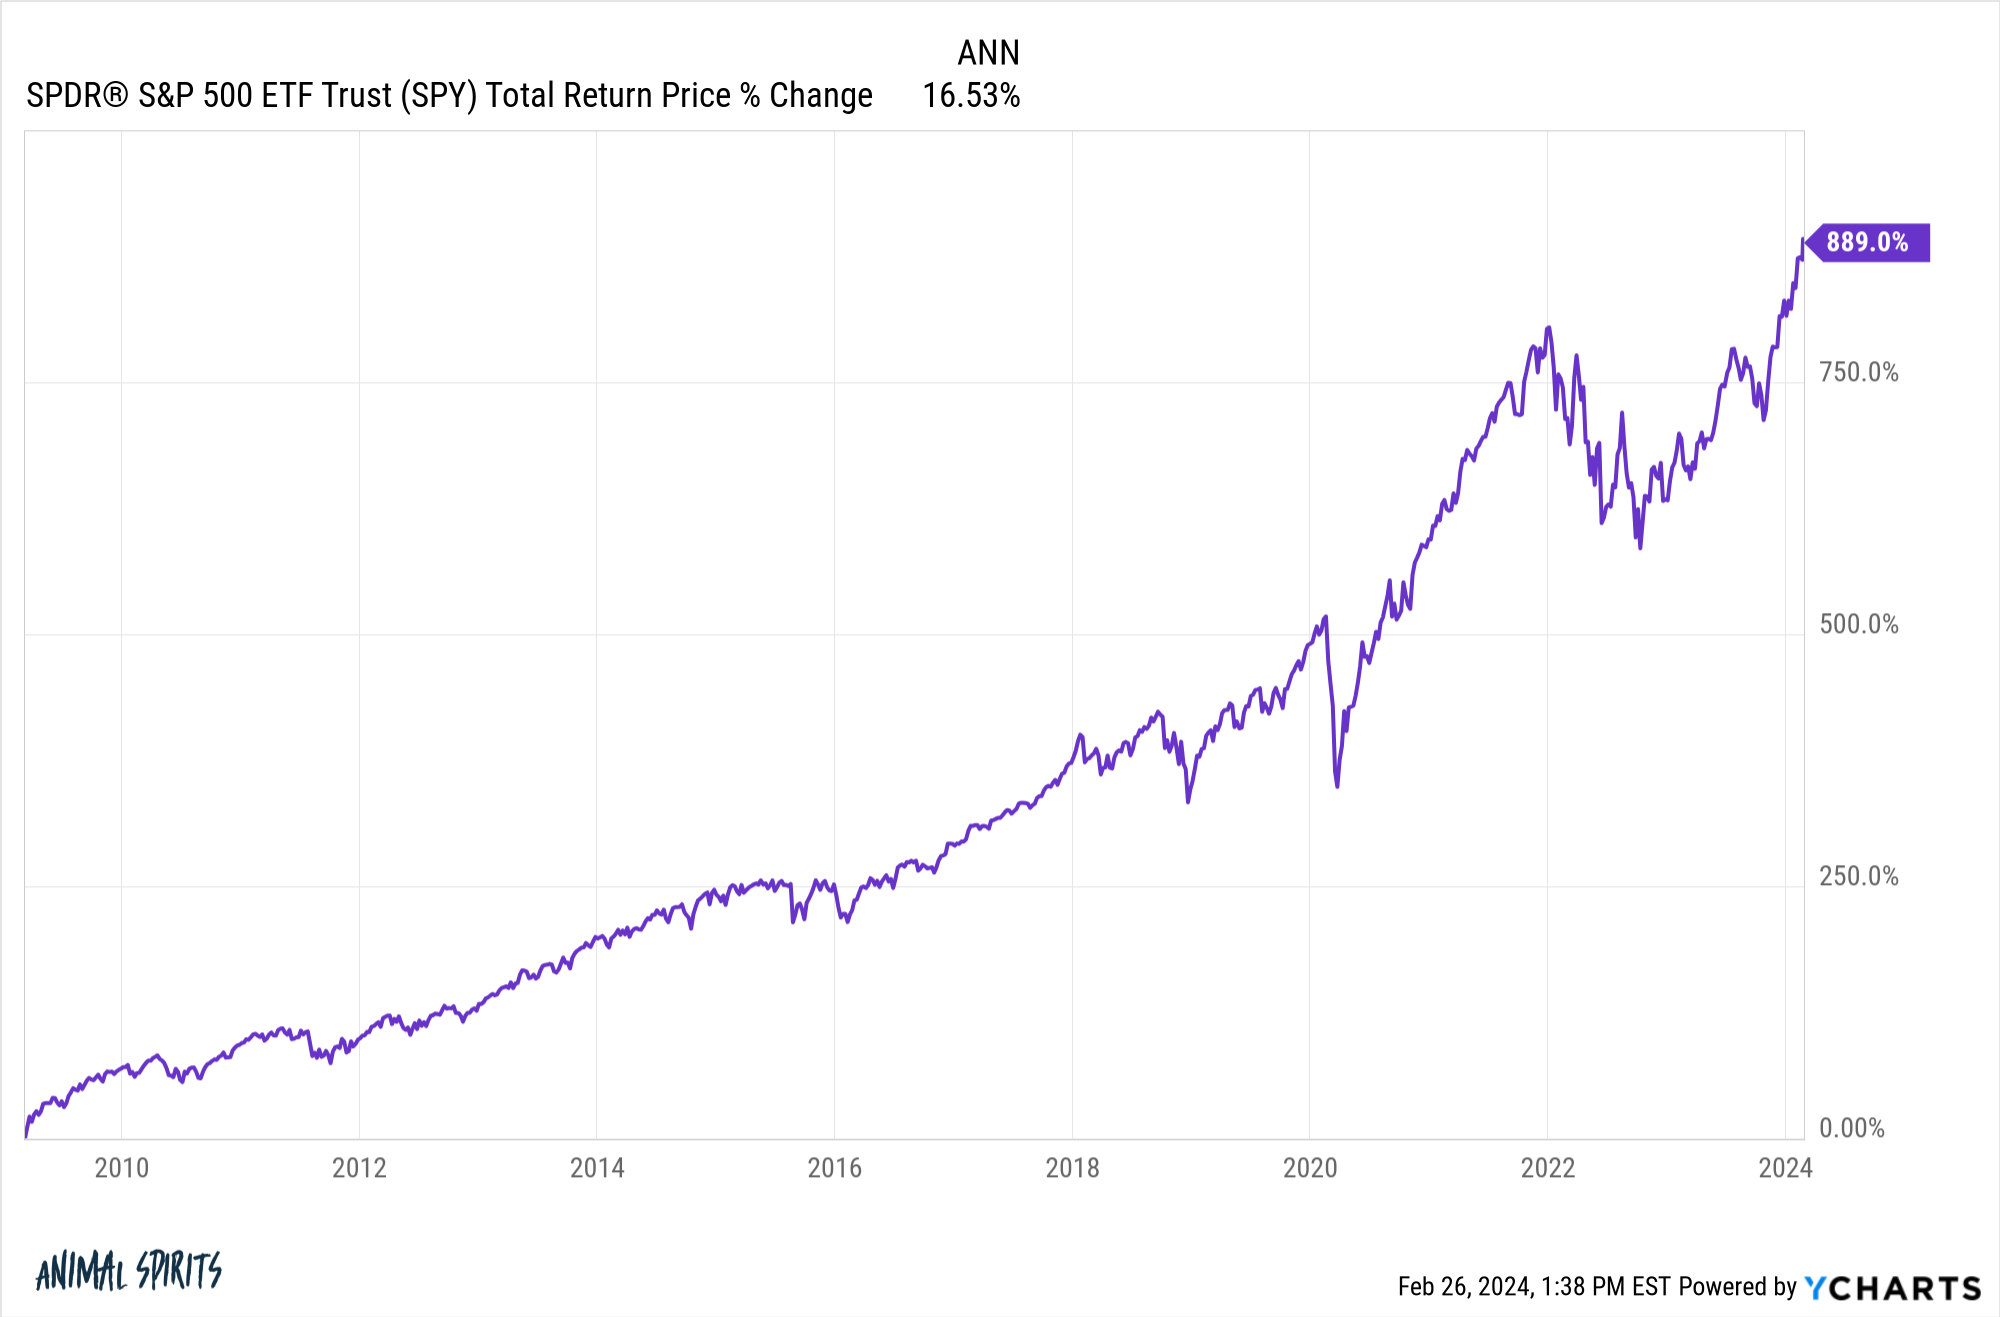
That’s a total return (with dividends reinvested) of almost 900% since the Great Financial Crisis lows. That’s close to 17% per year for a decade-and-a-half.
And people were calling it a bubble the entire way up.
Sure Ben, returns look great from the depths of a 55% crash but what if you weren’t that lucky? What if you put your money to work at the highs before the crash?
Your money got cut in half and then some from 2007-2009. You also would have lost more than 19% in the 2018 correction, 34% during the Covid crash and 25% in the 2022 inflation bear market.
If you had the unfortunate timing of top-ticking the stock market right before it got cut in half and then some, your returns would still look pretty good over the long-haul:
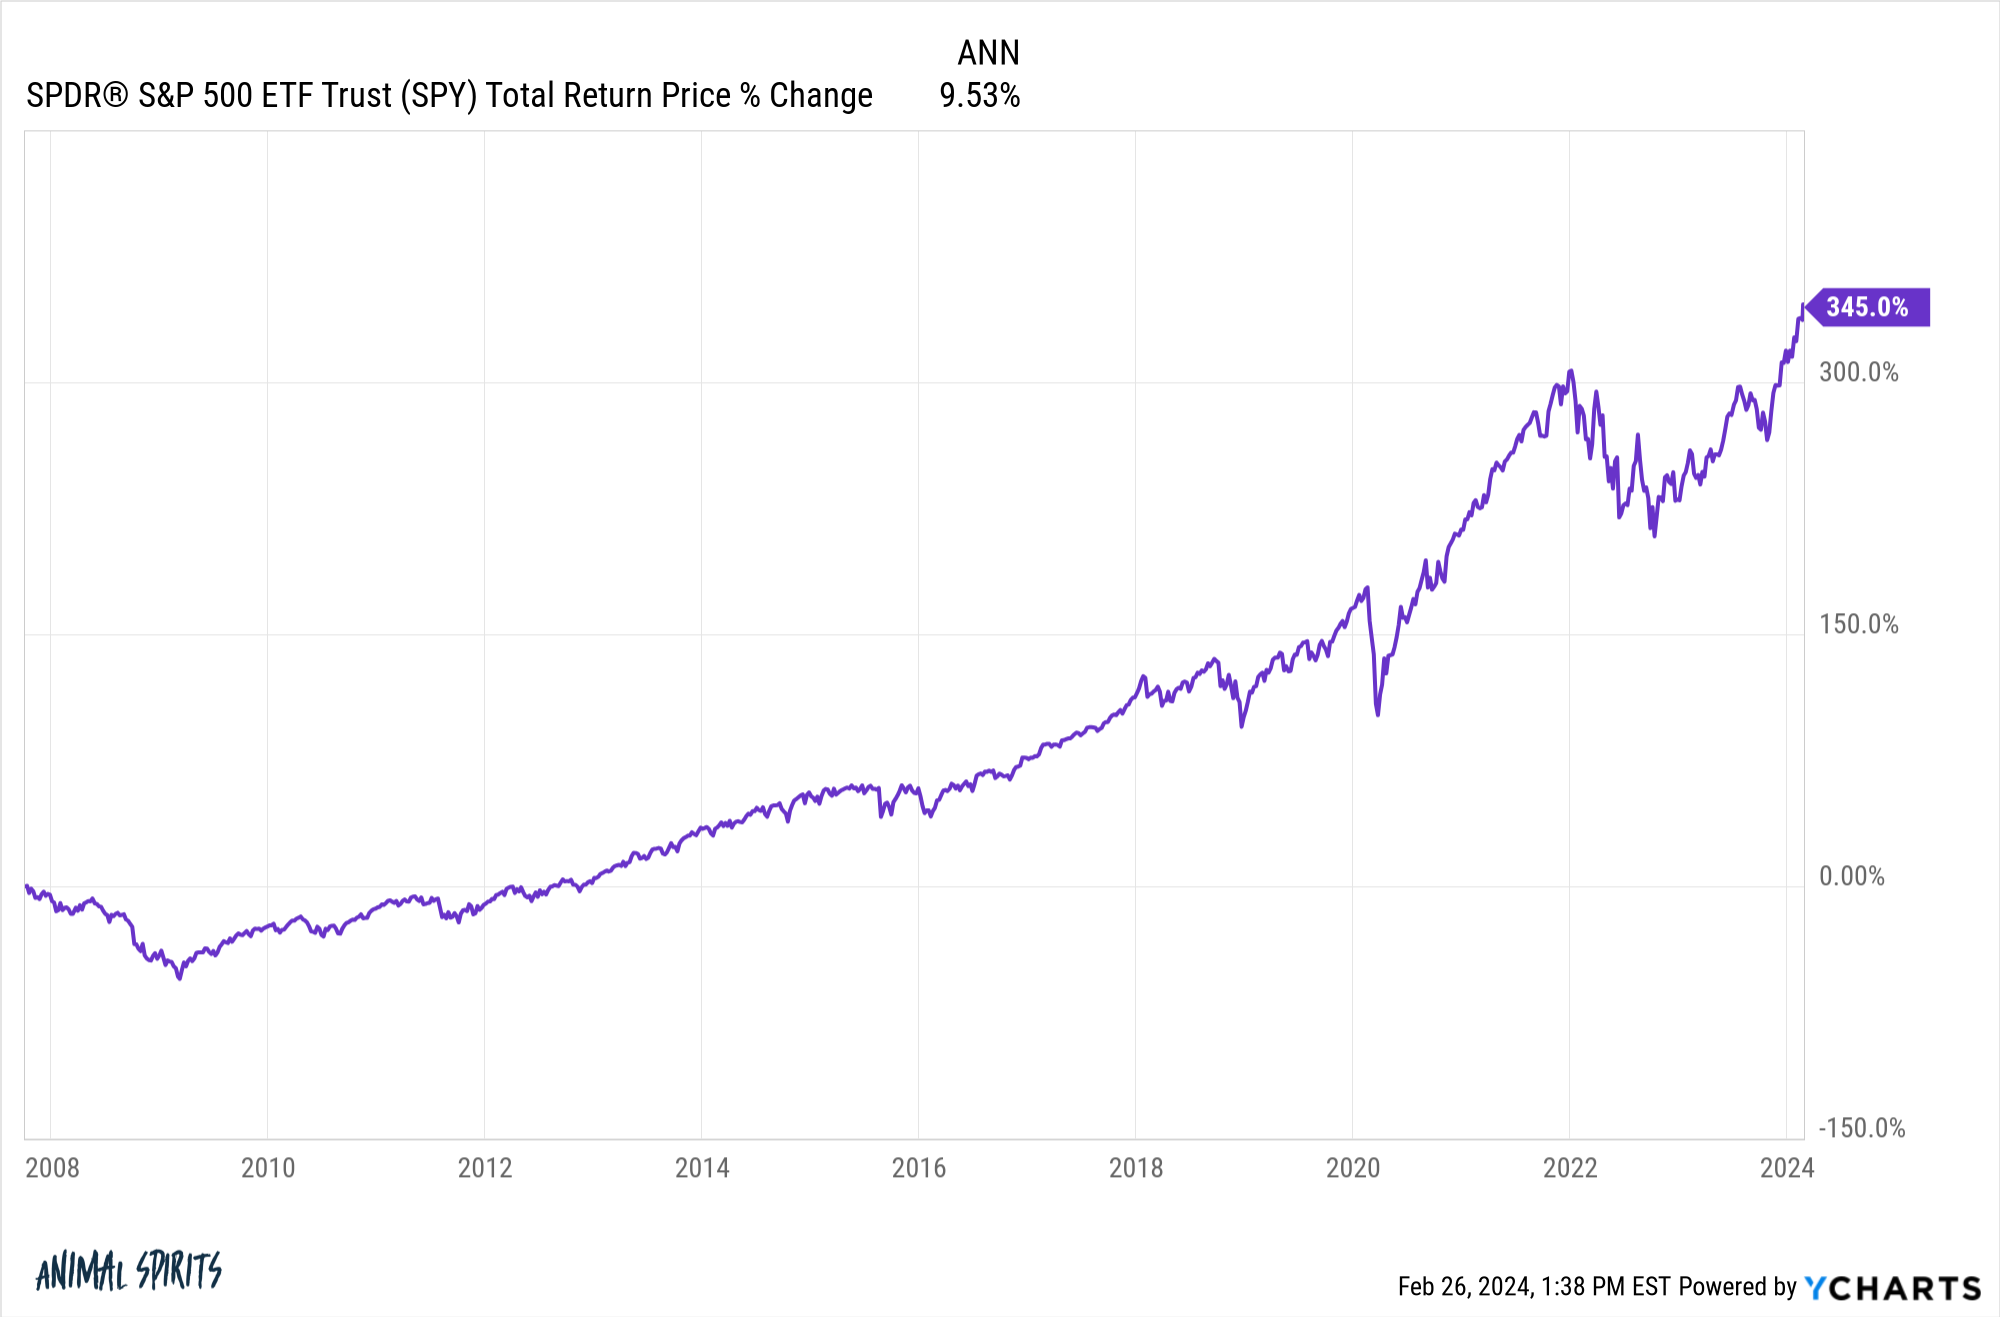
From the market peak just before the financial crisis ripped your face off, the S&P 500 is up just shy of 350% in total. That’s good enough for annual returns of 9.5% per year, which is essentially the long-term average over the past 100 years.
Of course, you would have had to sit through some rather uncomfortable
This is the drawdown profile investors have experienced since the peak in October of 2007:
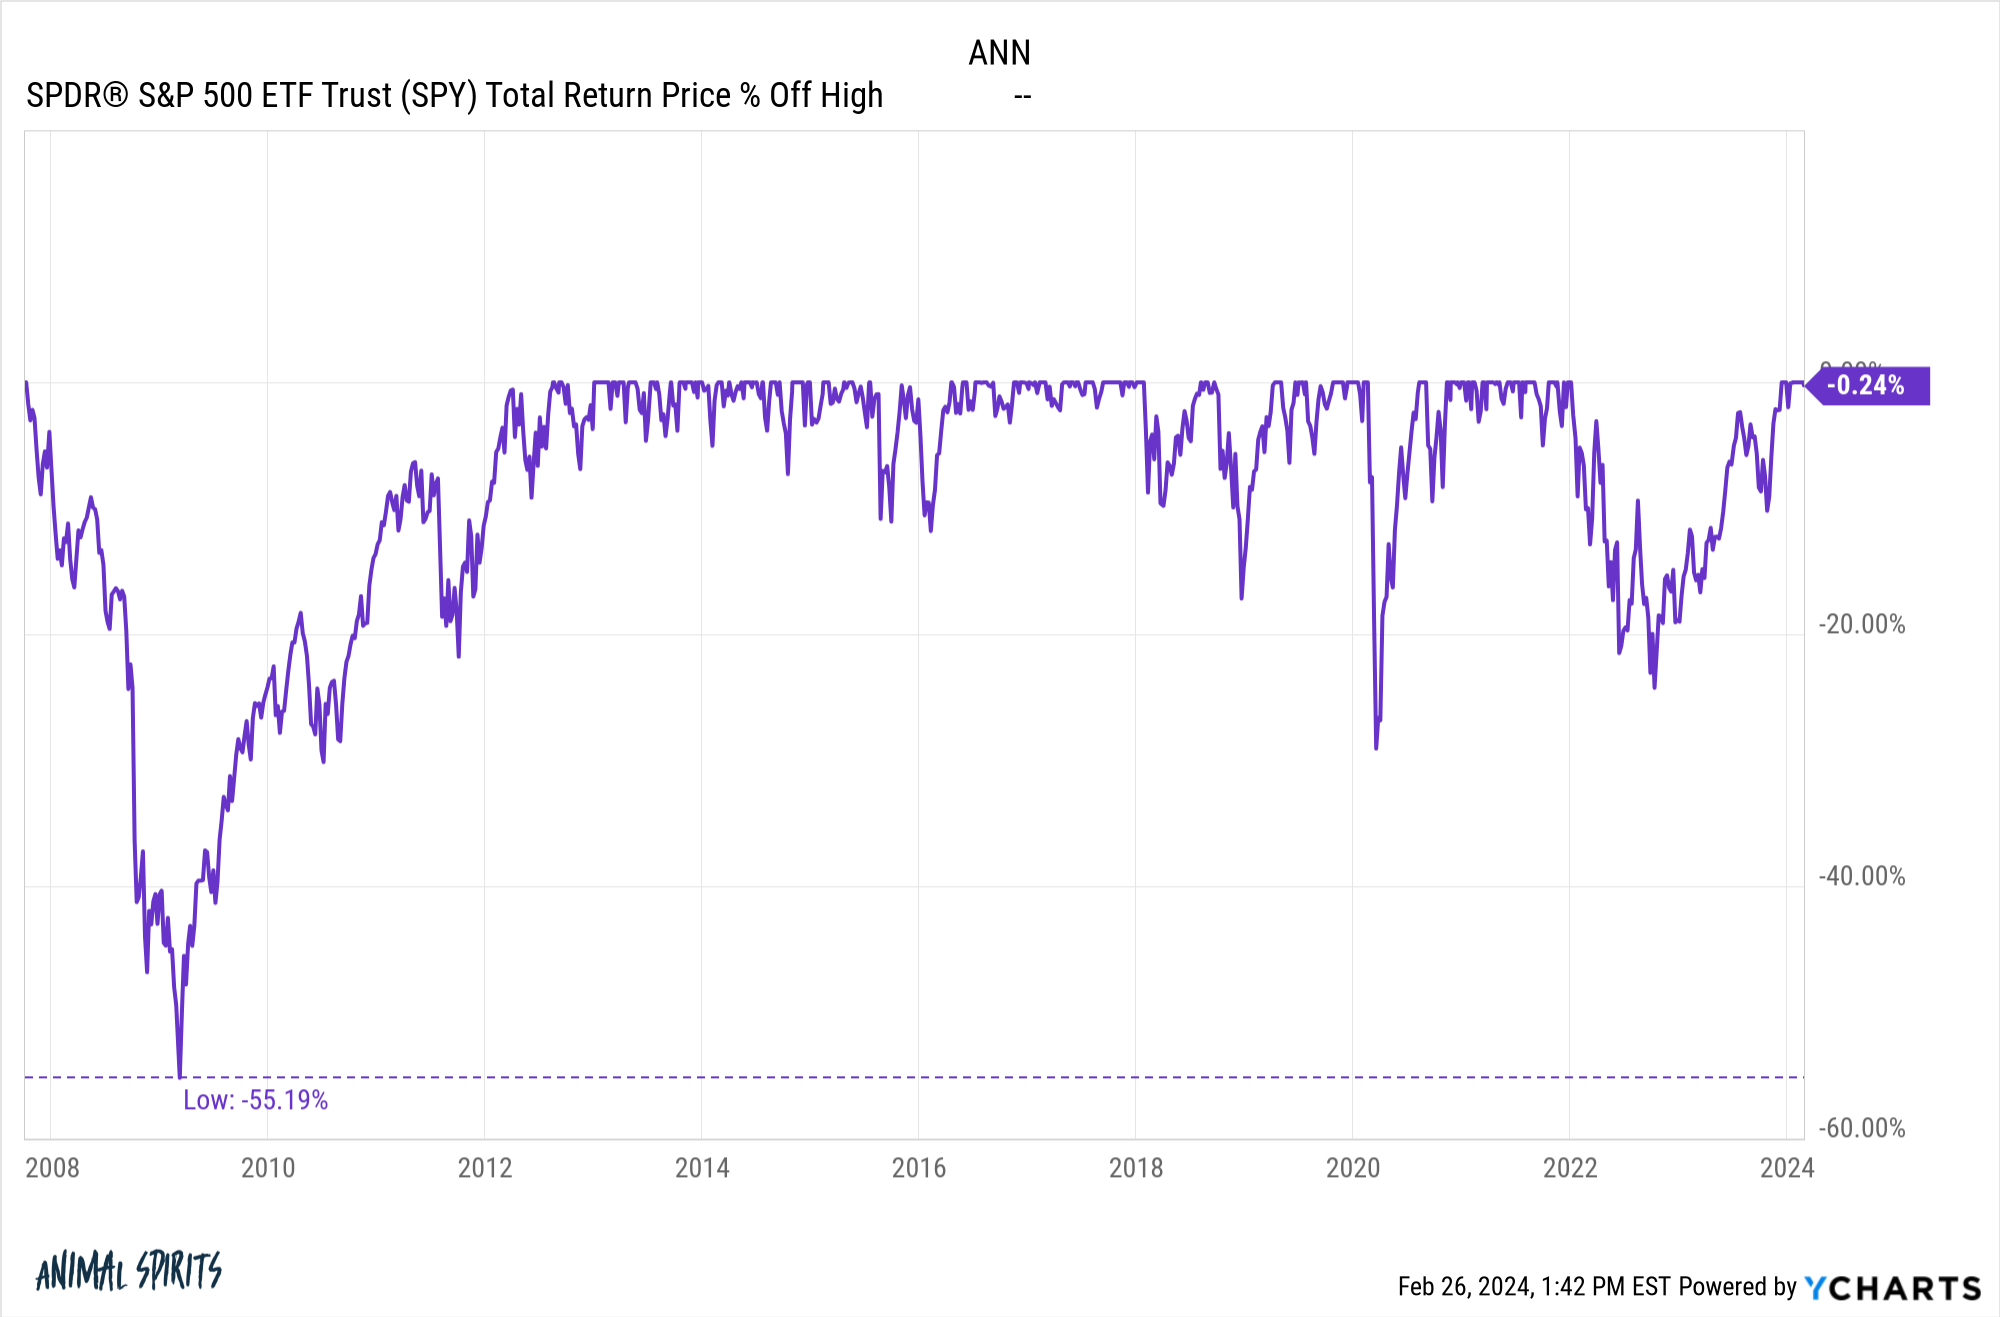
The best defense against significant losses in the stock market is a long enough time horizon.
Obviously, no one is good enough to put all of their money in at the bottom or unlucky enough to put all of their money in at the top on a consistent basis.
But it’s worth pointing out that the long-run in the stock market is pretty similar to what we’ve seen since 2007.
There are crashes, bear markets, and corrections on occasion.
There are periods of time when the stock market more or less goes nowhere.
And there are rip-roaring bull markets.
Shake it up, put it all together, and this is the experience you get when investing in the stock market over longer time frames.
The historical 9-10% annual return in the stock market isn’t simply made up of the good stuff. Those results include some pretty gnarly periods of volatility.
And one of the main reasons we get to experience bull markets like the one we are living through today is because there is always the chance of a crash like we experienced in 2008.
You don’t get the good without the bad.
You don’t get the gains without the losses.
You don’t get the reward without the risk.
Further Reading:
What If You Only Invested at Market Peaks?
1Sometimes I look for an excuse to use this instead of 13. Kind of like how TV critics like to say the penultimate episode as opposed to second-to-last.
