Something interesting happened this week that has never happened before.
According to Ryan Detrick, three weeks ago, AAII bulls made a 52-week high. And then stocks fell, and bulls went into the fetal position. Bears now outnumber bulls almost two to one. This about-face happened at a breakneck speed never before witnessed. Here’s the chart from Liz Ann Sonders.
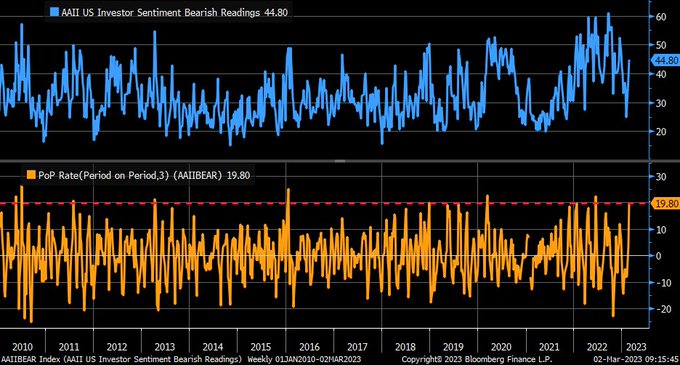
There’s an interesting dynamic at play in which “everyone” seems to be bearish on stocks except the stock market itself.
The bear market in stocks was largely driven by inflation and the fed’s response to it. The S&P 500 first entered “bear market territory” on June 13th, 2022. In the two days leading up to that decline, interest rates spiked. The 2-year went from 2.8% to 3.36% in just two sessions. At the time, that was well ahead of the fed fund rate, which was sitting at a target range of 75-100 basis points. The short end of the curve was telling you that more hikes were coming, and the stock market braced for impact.
The S&P 500 has been in a bear market for eight months. Since the time it first hit that threshold, the 2-year went from 3.36% to 4.86%, and the fed funds rate went from a target range of 75-100 bps to 450-475 bps. If somebody told you in June where interest rates would be eight months later, you would probably assume that the stock market would be much lower. That intuition would have been wrong.
While the stock market did go lower, the S&P 500 is 8% higher since June despite all the interest rate hikes, despite the feeling that a recession is coming, and despite the fact that the fed is going to do even more rate hikes.
Not only is the stock market higher, but it actually acts like it wants to go even higher. Now, before I get to some charts, it is worth pointing out that the stock market is not all-knowing. Things can turn south in a hurry. This post might look silly by the end of next week. But when the majority of market participants and economists and strategists all agree that things are going to get worse, and the market is telling you something different, I think it’s at least worth asking the following question; what does the market know that we don’t?
Let’s start with industrial stocks, which have the highest correlation to economic activity. XLI is near a 52-week high and is less than 4% from an all-time high. This is not something you would expect to see if the market was about to roll over.
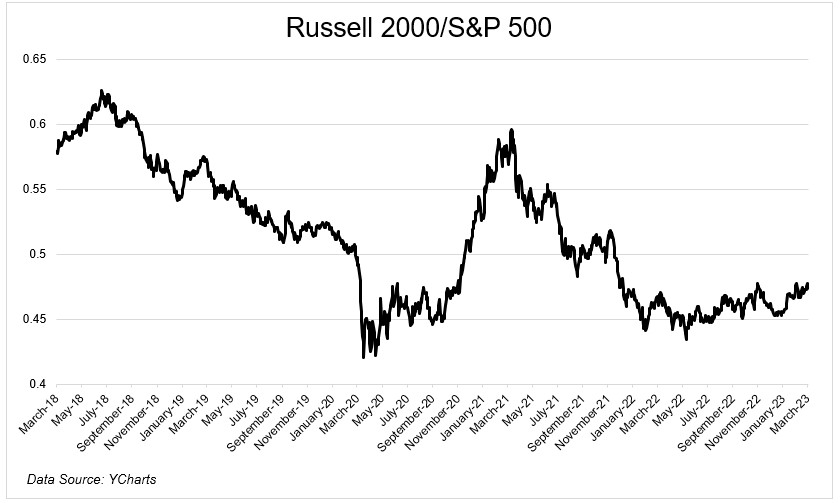
Small-cap stocks relative to large-cap stocks are right near their 52-week high and could get going in a hurry if it breaks out of this range. Again, not something you would expect to see if things were as bad as all the worry out there.
Transportation stocks, which should be a decent barometer for forward expectations of economic activity, have been hanging in there. Semiconductors, which are the modern-day transports in that they power activity that moves around digital information, are 39% off their lows and have been making higher lows for the past six months.
Hyatt is at an all-time high. Meaning its share price has never been higher. Discover financial services, which is a good barometer of consumer credit risk, is holding up well. JP Morgan, the largest consumer bank in the United States, is on the verge of a massive breakout. Wynn and Las Vegas Sands are on fire. United Airlines is at a 52-week high.
And on the flip side, the three weakest sectors year-to-date are the ones that are thought to be the most defensive; utilities, health care, and consumer staples. Not something you would expect to see if the market was concerned about what’s to come.
Okay, you get the point.
It’s not hard to find bearish charts, and it’s incredibly easy to be bearish right now, but when the stock market is so detached from the story, I’ll take the market ten times out of ten.

