
You may have missed this wonderful Josh Zumbrun column in the Wall Street Journal last week: “Inflation and Unemployment Both Make You Miserable, but Maybe Not Equally.”
It’s one of those things that are so obvious no one ever stops to think about it – and so we have overlooked this for decades.1
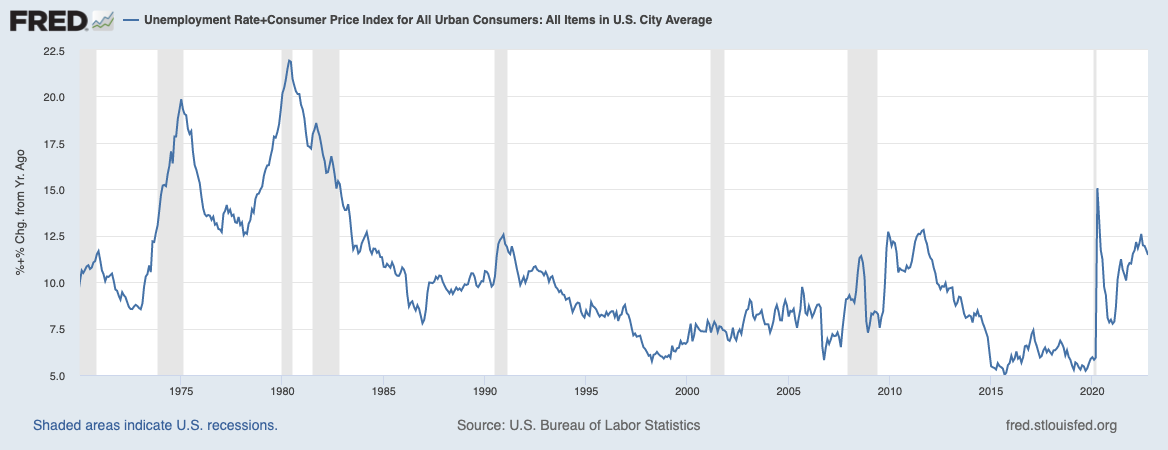
Stop for a moment and consider the original Misery Index formula as invented by the economist Arthur Okun: add the 3.7% unemployment rate (BLS NFP) to the 7.7% inflation rate as measured by the consumer price index (BLS CPI). The total is 11.4%, which as you can see on the chart above, is pretty high.
Or is it? Should it be?
The Misery index dates to the 1970s, which was a period of high inflation AND high unemployment. And it was a miserable economic time, with both of these elevated measures together creating a period of unhappy people that the Misery index neatly captured.
People were miserable, so directionally, the index was correct. But what about amplitude? As Zunbrun observes, “The Misery Index, as commonly constructed, doesn’t adequately capture how overall economic conditions affect attitudes.”
We have previously been asking an abstract question: Which is worse, higher inflation, or higher unemployment? The two components of the Misery Index were treated equally, but we should be asking: Should they be? It turns out we never really considered this question. Today, with only one of these two measures elevated, we should.
Forget the academic abstract query, and instead ask a person individually which set of circumstances they would prefer: Do you want to pay more for goods and services or would they prefer to be unemployed?
Interesting question about the components of the Misery Index: Inflation + Unemployment
Which would you prefer?
— Barry Ritholtz (@ritholtz) November 21, 2022
I had never considered this until now, but once you do, the answer is terribly obvious: Of course people don’t want to lose their main source of income. However you may describe Inflation, it sucks: A loss of buying power, a tax on consumers, a decrease in the value of savings, and a drag on GDP. These are all annoyances of greater or lesser proportion to various people.
But now consider the other half of the index: What happens when you are unemployed? It’s a horrific experience, that crushes a family’s budget, gets people evicted, makes people reconsider their own career choices, and second-guess their worth; it can even lead to crime.
Zunbrun cites University of Warwick professor Andrew Oswald’s 2001 paper surveying 300,000 people living in the US. Oswald discovered:
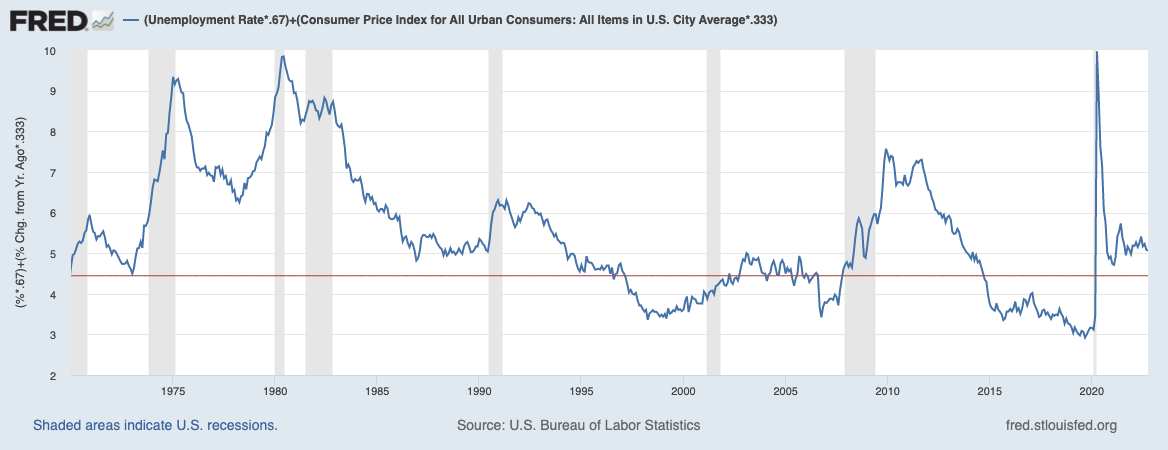
“A 1-percentage-point increase in the unemployment rate had an equivalent impact on happiness as a 1.97-point increase in the inflation rate. Mr. Oswald said that if he were to construct a Misery Index, he would make a simple modification: Multiply the unemployment rate by two and add it to the inflation rate.” (Emphasis added).
Two for one is a huge adjustment.
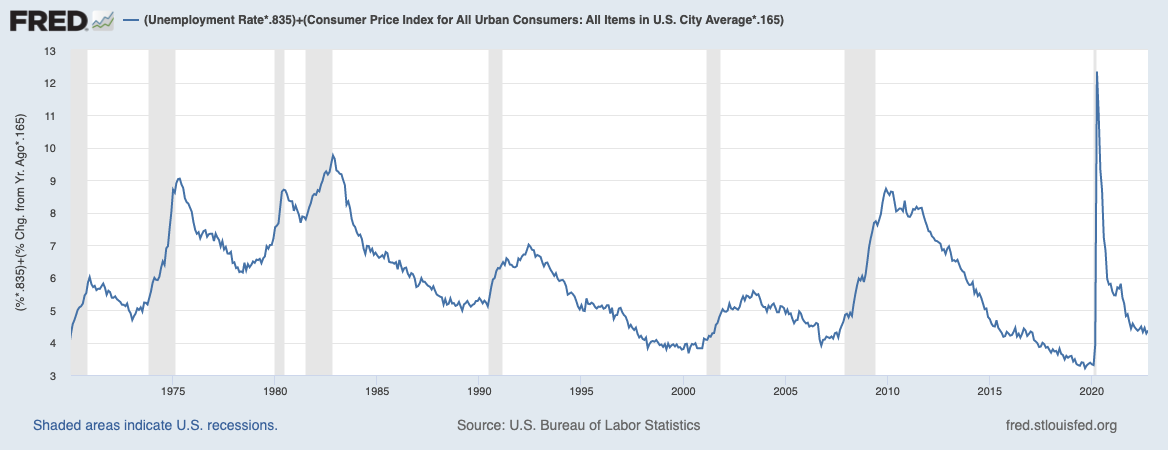
Professor Danny Blanchflower (a friend and occasional fishing buddy) looked at this question in 2013-14; what they discovered was closer to 5-to-1 difference:
“We find, conventionally, that both higher unemployment and higher inflation lower well-being. We also discover that unemployment depresses well- being more than inflation. We characterize this well-being trade-off between unemployment and inflation using what we describe as the misery ratio. Our estimates with European data imply that a 1 percentage point increase in the unemployment rate lowers well-being by more than five times as much as a 1 percentage point increase in the inflation rate. (Emphasis added)
That is an even bigger difference than the original Misery Index or professor Oswald’s survey found.
The ramifications of the Misery index being accurate directionally but inaccurate amplitude-wise showed up in the recent elections. As I noted the day after the midterms:
Inflation? Less Important: The rise of inflation as issue #1 in surveys? The election results strongly suggest that this was incorrect. Inflation matters but so too does the overall economy — the unemployment rate, wage gains, and fiscal stimulus during the pandemic. In other words, it’s complicated and nuanced, something surveys manage poorly.”
The Misery Index is a perfect example of one of those things we take for granted – we too often just assume something is correct; we fail to consider the details closely. It is a timely reminder about easy it is to be wrong about broad topics or fool ourselves via motivated reasoning.
Always return to first principles…
UPDATE: November 21 2022
Here is what it looks like if we play around with the ratios, both 2-to-1 and 5-to-1; click ratios for FRED charts; click images below for larger charts
2 to 1 Unemployment to Inflation (Oswald)
5-to-1 Unemployment to Inflation (Blanchflower)
charts by Invictus
See also:
The Happiness Trade-Off between Unemployment and Inflation (JSTOR, Vol. 46, October 2014)
Economic Discomfort and Consumer Sentiment (SSRN Apr 2000)
Previously:
When Narratives Collapse (November 18, 2022)
Unconventional Wisdom (November 9, 2022)
What’s Driving Inflation: Labor or Capital? (November 7, 2022)
Behind the Curve, Part V (November 3, 2022)
When Your Only Tool is a Hammer (November 1, 2022)
Who Is to Blame for Inflation, 1-15 (June 28, 2022)
Source:
Inflation and Unemployment Both Make You Miserable, but Maybe Not Equally
By Josh Zumbrun
WSJ, November 18, 2022
___________
1. Like the arrow in the FedEx logo – but once you have it pointed out, you can never unsee it.
