I’ve been writing at A Wealth of Common Sense for more than 10 years now.
That means we’re going on a decade’s worth of asset allocation quilts on this blog. The moral of the story is I’m getting old.
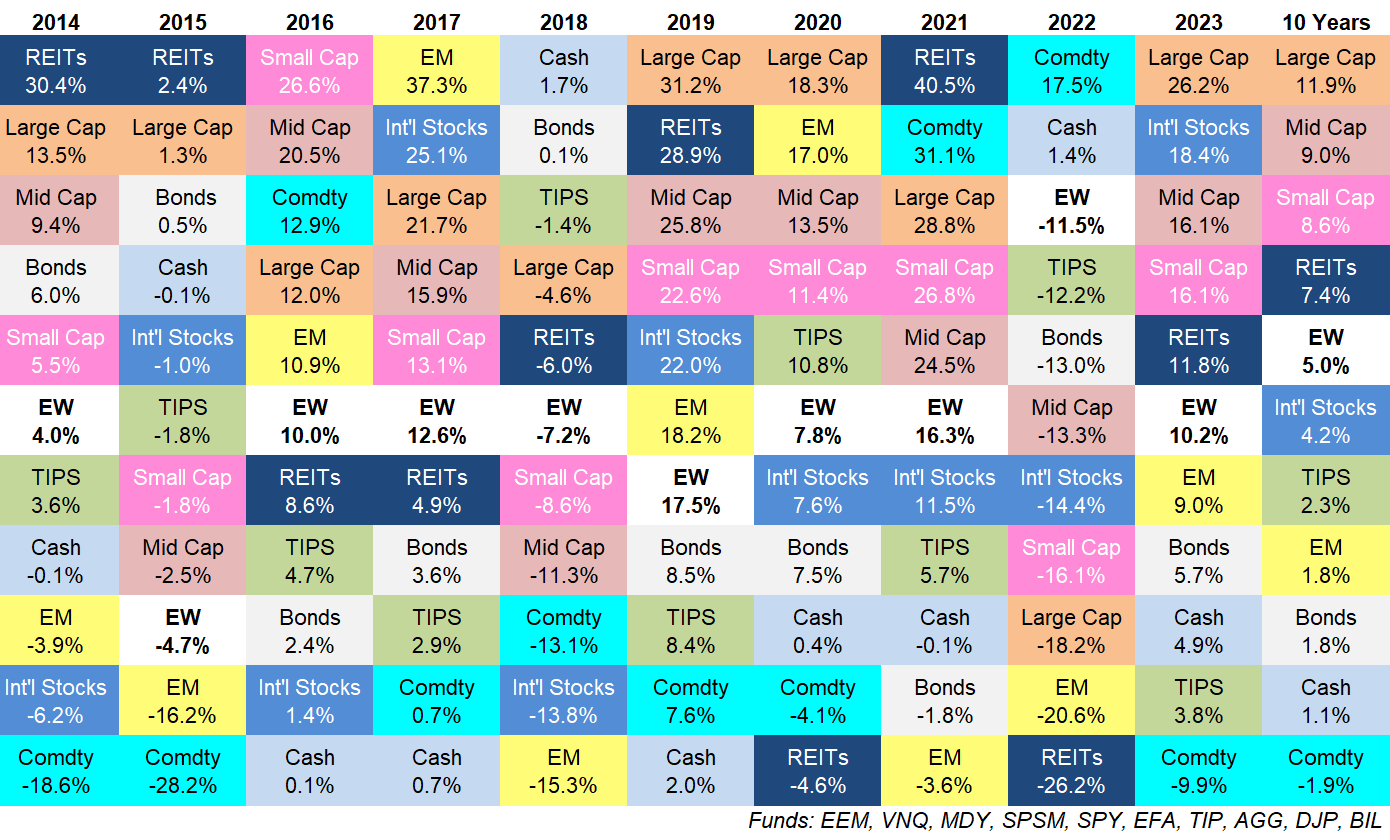
Here’s the latest update through the end of 2023 along with those 10 year trailing returns:
Some observations:
Bad to good and good to bad. Last year was bad for the majority of asset classes. This year was good.
Last year commodities did well. This year they didn’t.
Last year stocks got crushed. This year they bounced back.
Last year an equal-weighted portfolio of these asset classes was down double-digits. This year it was up double digits.
Markets aren’t always so black and white like this but sometimes mean reversion rules the day.
What will it take for commodities to outperform? Hard assets had good performance in 2021 and 2022.
There was talk of a supercycle. Inflation was running hot. There was war in Ukraine and the Middle East. Government spending and debt have been out of control.
Yet commodities fell yet again in 2023.
The 10 year returns are still negative.
In fact, a basket of commodities is down nearly 50% in total since the start of 2008, a time in which the S&P 500 is up almost 350%.
Commodities are cyclical so that will mean big upside volatility eventually. I just don’t know when.
Large caps rule everything around me. The S&P 500 was the leader of the pack yet again.
Large cap U.S. stocks have been outperforming basically everything else since the Great Financial Crisis.
From 2009-2023, the S&P 500 is up a stone’s throw from 14% per year. That’s a total return of close to 350%.
Even if we include 2008, the when the S&P fell 37%, large caps are up 10% per year through 2023.
This can’t last forever but I’m not going to complain about good returns on the biggest stock market in the world.
Emerging markets are down bad. Remember when the BRICs were going to take over the world?
That was a good story in the early 2010s.
EM has basically been the opposite of the S&P 500 this century.
From 2000-2007, emerging market stocks were up more than 210% in total (15.3% a year) while the S&P 500 was up a total of just 14% (1.7% a year).
From 2008-2023, emerging markets are up a total of 28% (1.3% a year) versus the aforementioned 350% gain for the S&P 500.
Small caps and mid caps have held up well. It seems like it’s only just the biggest stocks in the United States doing well but small and mid caps have held their own.
The S&P 400 and S&P 600 are each up around 9% per year for the past 10 years.
That’s pretty good considering how much cheaper these stocks are than the S&P 500 right now.
Cash had a good year. From 2008-2022, 3-month T-bills were up a total of just 13%. That’s an annual return of around 0.8% per year.
That makes sense considering how low the Fed held short-term interest rates for so long. Rates aren’t so low anymore.
Short-term T-bills were up almost 5% in 2023. That’s the best year for cash equaivalent since the year 2000 and the first time returns were over 4% since 2007.
You can thank the Fed.
We’ll see how long those yields last.
Bonds have had a rough stretch. The Aggregate Bond Index has roughly the same return at T- bills over the past 8 years.
Low starting yields combined with rising rates have led to a challenging market for fixed income investors.
Higher starting yields from current levels should help going forward.
I have no idea what this quilt will look like next year. The reason this is my favorite performance chart is that it perfectly illustrates how difficult it is to predict the winners and losers in the short run.
There is no rhyme or reason to asset class performance from one year to the next.
Sometimes you get mean reversion. Other times momentum rules the day.
Sometimes asset class performance goes worst-to-first or first-to-worst. Other times the performance rankings take a random walk.
Investing would be a lot easier if you could predict the winners from year to year and simply shift your allocation around to sidestep the losers.
I’ve never met an investor who has the ability to pull this off on a consistent basis.
Diversification means constantly feeling regret about something in your portfolio that’s underperforming. That’s a feature, not a bug.
It also means having something else in your portfolio that’s outperforming.
Investing itself is a form of regret minimization.
You can concentrate your portfolio and have regret on occasion when you inevitably underperform. Or you can diversify and have regret all the time when something underperforms.
Pick your poison.
Further Reading:
Updating My Favorite Performance Chart For 2022
