

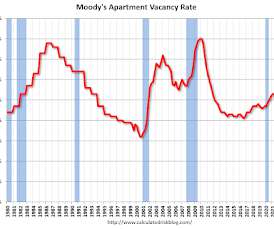
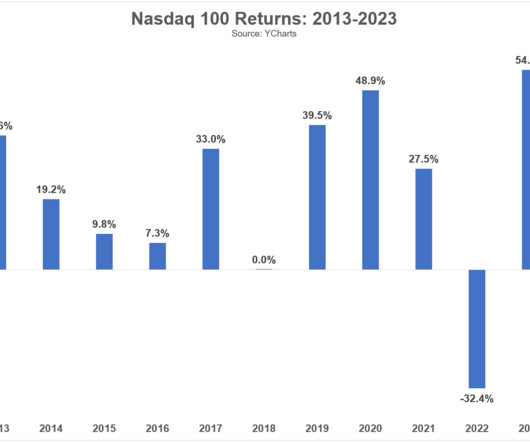
The Fastest Drop in Home Prices Since 2009
The Reformed Broker
OCTOBER 3, 2022
The post The Fastest Drop in Home Prices Since 2009 appeared first on The Reformed Broker. Previous to her current position, Skyler founded a consultancy supporting public-facing economic data program, was head of economics at a digital mortgage start-up, and spent 8 years supporting the Zillow economic research department.


Let's personalize your content